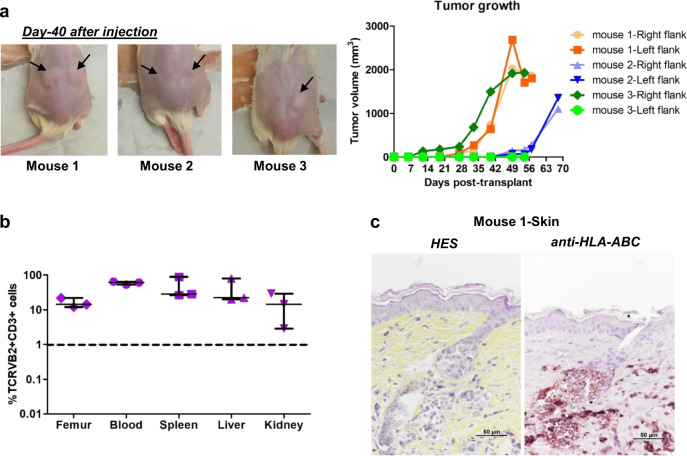
Fig. 3. Renewal of patient SCs in secondary transplant at skin site.
0.4–2 × 10⁶ tumor cells (TCRVβ2 + CD3 + CD4 + CD8-) from patient #2 derived from primary xenograft were injected percutaneously in secondary NSG mice and percutaneous tumor volume was measured during 8–10 weeks after transplantation. a Pictures showing cutaneous tumors in mice. Arrows indicate the site of tumor formation. Tumor size were measured weekly until the sacrifice. The graph represents the evolution of tumor volume. b Mice were sacrificed when the skin tumor volume reached 2000 mm3. The cells from different tissues were prepared and percentage of TCRVβ2 + CD3 + cells analyzed by FACS. Graph represents the percentage of TCRVβ2 + CD3 + cells in femur, blood, spleen, liver and kidney. For each tissue, median and range are shown. c Skin lesion of mouse 1 was analyzed by HES staining and human cells identified by HLA-ABC immunostaining in skin section. A marked dermal infiltration and regular pilotropism of HLA-ABC positive cells was observed in all mice.

