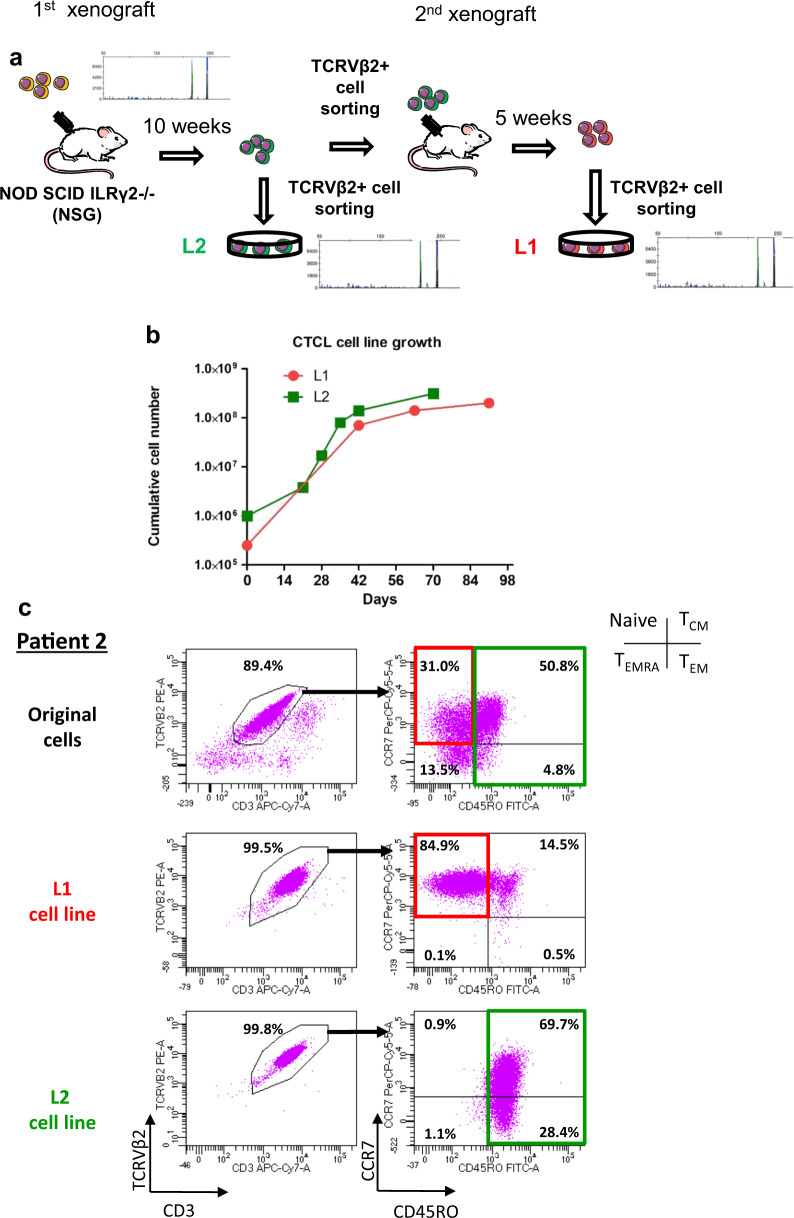
Fig. 5. Development of different SC lines from a single patient #2 by sequential xenografting.
a Schematic representation of L1 and L2 cell lines production from primary and secondary xenografts described in Fig. 2 and Supplementary Fig. S4. TCRγ gene rearrangements between the two PDX cell lines and original sample were determined by the Biomed-2 protocol and are shown on the diagram. b PDX cells after primary and secondary engraftment were cultured with cytokines mix B described in Material and methods and counted every week. Graph represents cumulative cell number along the culture. c Immunophenotype of L1 and L2 cell lines was evaluated before (original cells) and at the end point of the culture according to TCRVβ2 and CD3 expression to quantify tumor cells. Inside TCRVβ2 + CD3 + population, CCR7 and CD45RO expressions were used for assessing T-cell maturation stages (naive, TCM, TEM, and TEMRA).

