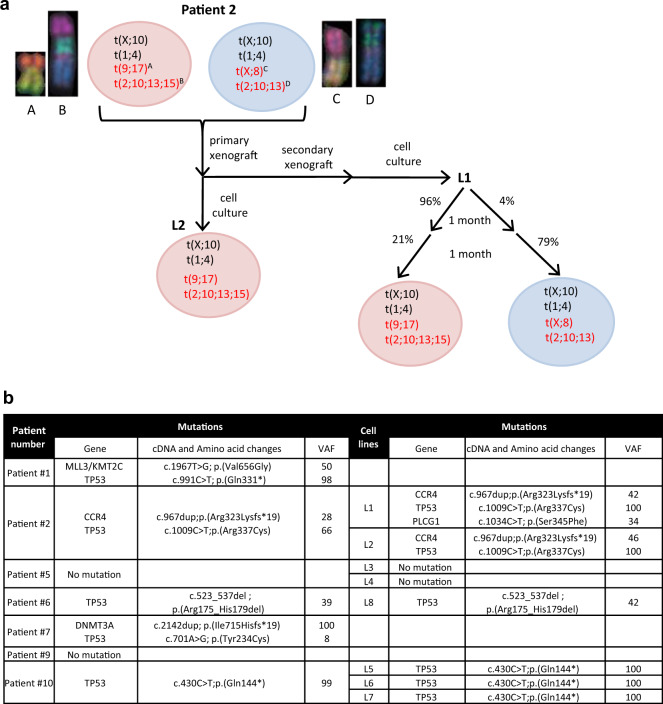
Fig. 6. Clonal heterogeneity and evolution of SCs revealed by PDC and PDX models.
a mFISH and aCGH analyses were performed for patient #2. Schematic representations show the clonal heterogeneity in original patient sample and after culture of PDX. Alterations mentioned in black are examples of shared alterations. The red ones are additional alterations distinguishing different sub-clones illustrated by mFISH pictures. Circles with different colors distinguish the distinct sub-clones before and after amplification. b Identification of genomic alterations found in original samples and after cell line expansion using a panel targeting 19 most frequently altered genes in SS. VAF: Variant allelic frequency.

