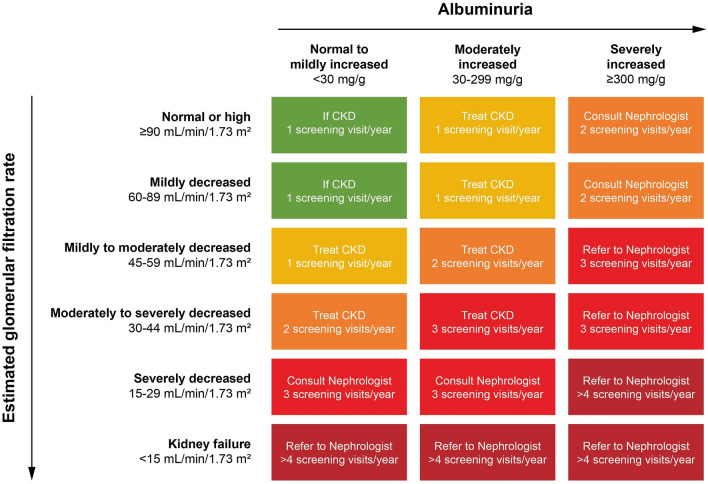
Fig. 1.
Risk of CKD progression, frequency of visits, and referral to a nephrologist according to glomerular filtration rate (GFR) and albuminuria. The GFR and albuminuria grid depicts the risk of progression, morbidity, and mortality by color, from best (green) through yellow, orange, and red to worst (dark red). CKD Chronic kidney disease.
Modified from Kidney Disease: Improving Global Outcomes (KDIGO) CKD Work Group [61], copyright 2013, with permission from Elsevier

