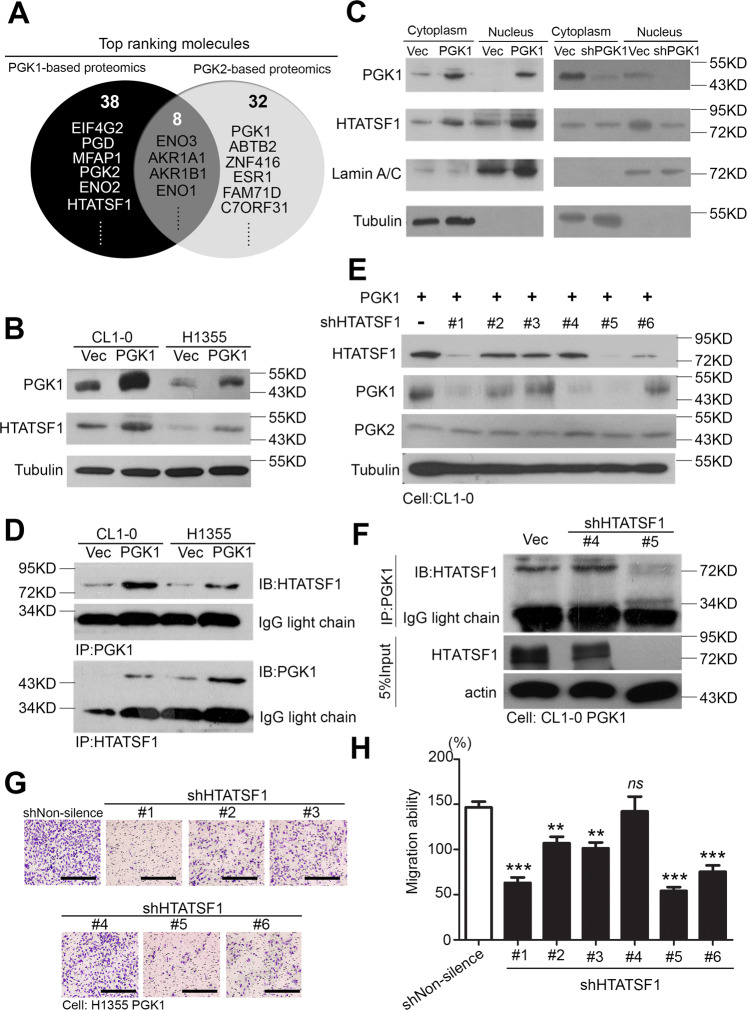
Fig. 5. PGK1 directly binds to HTATSF1 via protein–protein interactions and promotes migration.
A The molecules that indicated to interact in the PGK1- or PGK2-based proteomics profiles according to BioGrid website analysis. B Western blot analysis of PGK1 and HTATSF1 expression from CL1-0 and H1355 cells with the forced expression of the vector control or exogenous PGK1 gene. C Western blot analysis of PGK1 and HTATSF1 protein levels in the nuclear protein fraction and cytoplasmic fraction derived from PGK1 two-way models. D Pull-down assay for whole-cell lysates derived from CL1-0 and H1355 cells with the forced expression of PGK1 or vector control using beads followed by western blot analysis of the HTATSF1 and PGK1 proteins. E Western blot analysis of HTATSF1, PGK1 and PGK2 expression from CL1-0 cells with or without the shHTATSF1 clones. F Pull-down assay for whole cell lysates derived from CL1-0 PGK1 cells with or without the shHTATSF1 clones using beads followed by western blot analysis of HTATSF1 proteins. G Representative Giemsa staining to estimate the migration abilities of the H1355 PGK1 cells transfected with the designated shRNA clones of the HTATSF1 gene. Scale bar: 100 μm. H Cellular migration abilities of the H1355 PGK1 cells transfected with the designated shRNA clones of the HTATSF1 gene. The symbols **p < 0.01 and ***p < 0.001 in the nonparametric Mann–Whitney test.

