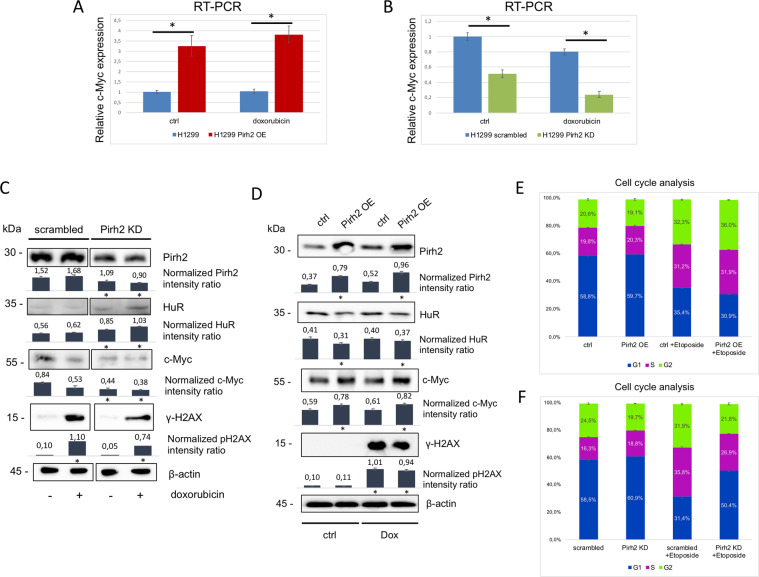
Fig. 5. Pirh2 activates c-Myc expression via downregulation of HuR.
A Pirh2 upregulates c-Myc mRNA level in H1299 cells. qRT-PCR results of c-Myc expression for H1299 cells with stable Pirh2 overexpression (Pirh2 OE) and control H1299 cells (ctrl), both in normal conditions and after 16 h treatment with 1 μM doxorubicin. *p ≤ 0.01 according to Student’s t-test. B Pirh2 knockdown leads to a decrease of c-Myc mRNA level. qRT-PCR results of c-Myc expression for H1299 cells with stable Pirh2 knockdown (Pirh2 KD) and control H1299 cells (scrambled), both in normal conditions and after 16 h treatment with 1 μM doxorubicin. *p ≤ 0.01 according to Student’s t-test. C Pirh2 upregulates c-Myc protein level in H1299 cells. Western blot analysis of c-Myc protein level for H1299 cells with stable Pirh2 overexpression (Pirh2 OE) and control H1299 cells (ctrl), both in normal conditions and after 16 h treatment with 1 μM doxorubicin. D Pirh2 knockdown leads to a decrease of c-Myc protein level. Western blot analysis of c-Myc level in H1299 cells with stable Pirh2 knockdown (Pirh2 KD) and control H1299 cells (scrambled), both in normal conditions and after 16 h treatment with 1 μM doxorubicin. The normalized intensity ratios were calculated as ratios between the signals of proteins analyzed and the corresponding actin bands on the basis of three measurements. Error bars indicate ±SD. *p ≤ 0.05 vs. scrambled (vs. untreated for γH2AX) according to Student’s t-test. E, F Analysis of cell cycle phases distribution for H1299 cell lines with stable Pirh2 overexpression (Pirh2 OE) and control H1299 (ctrl) (left panel), and H1299 cells with stable Pirh2 knockdown (Pirh2 KD) and control H1299 cells (scrambled) (right panel), both in normal conditions and after 24 h treatment with 100 μM etoposide. The test was performed in triplicates. Error bars indicate ±SD. *p-value ≤ 0.01 according to Student’s t-test.

