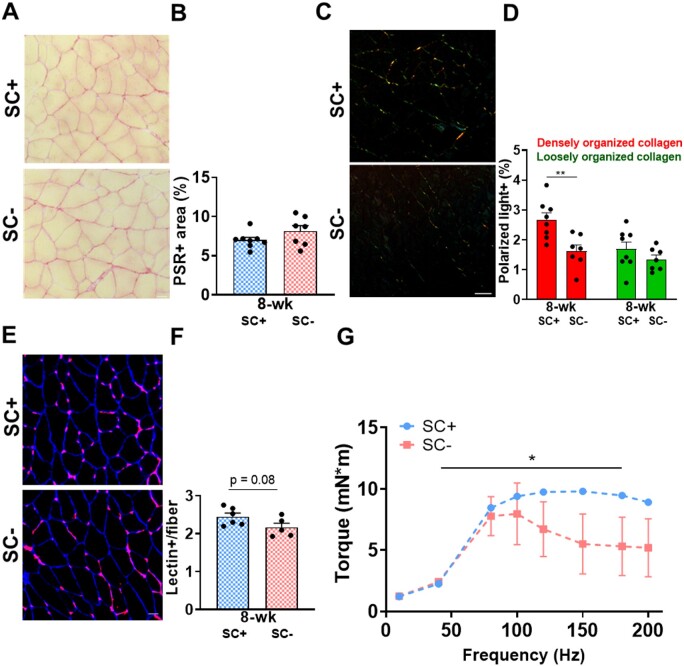
Figure 10.
Satellite cell depletion led to aberrant collagen remodeling, capillarization, and strength adaptation to PoWeR. (A) Representative PSR-stained soleus images visualized with bright field. (B) Relative area positive for PSR. (C) Representative PSR-stained soleus images visualized with polarized light. (D) Relative area of red and green emitted light. (E) Representative lectin (red) and laminin (blue) stained soleus images to identify capillaries and fibers. (F) Relative number of Lectin+ events. (G) Force frequency curve (n = 3/group). Scale bar = 50 µm. Data are represented as mean ± SEM. Statistical analyses: (B), (D), (E) unpaired two-tailed Student’s t-test, (G) repeated measures one-way ANOVA with Sidak’s multiple comparisons test. *P < 0.05, **P < 0.01.

