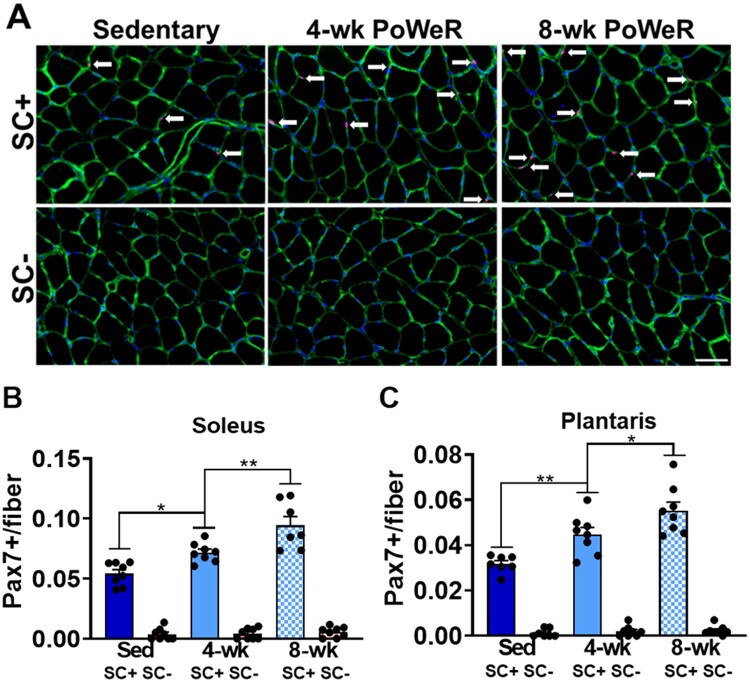
Figure 2.
PoWeR led to higher satellite cell content in the soleus and plantaris in SC+ mice. (A) Representative images of satellite cell IHC from the soleus across all groups showing laminin (green), nuclei (blue), and Pax7 (red; white arrows). (B) Satellite cell density in the soleus. (C) Satellite cell density in the plantaris. Scale bar = 50 µm. Data are represented as mean ± SEM. Statistical analysis: two-way ANOVA with Tukey’s multiple comparisons test. There was a main effect for PoWeR (P < 0.0001) and satellite cell depletion (P < 0.0001) in both the soleus and plantaris. There was a significant interaction between PoWeR and satellite cell content in the soleus (P < 0.001) and plantaris (P < 0.0001). *P < 0.05, **P < 0.01.

