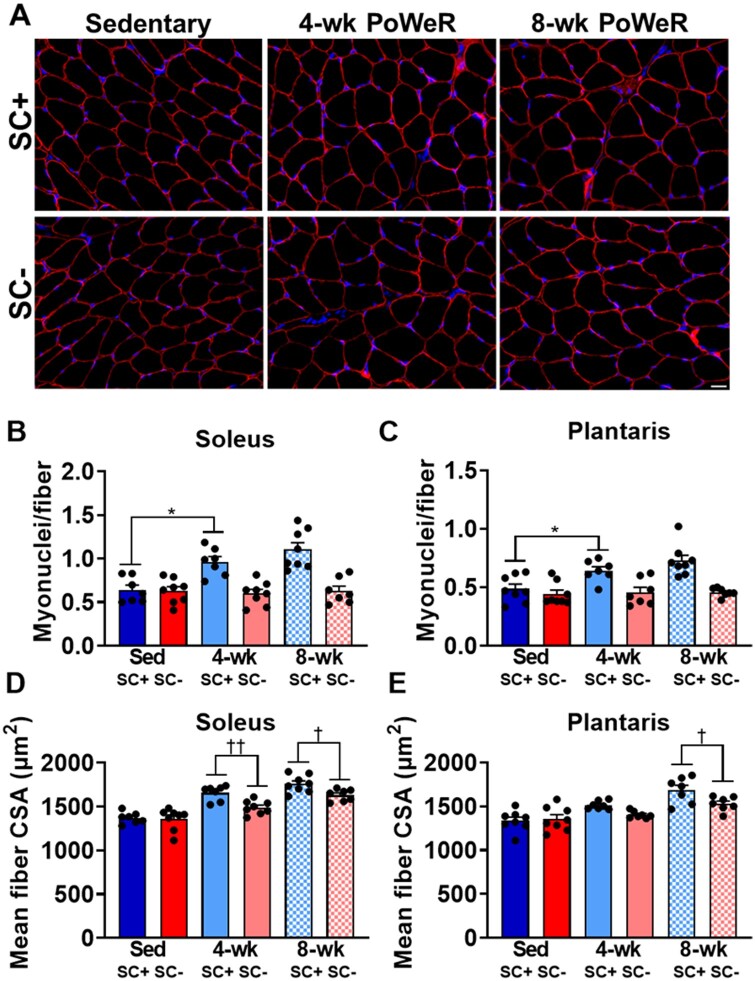
Figure 3.
Satellite cell depletion inhibited myonuclear accretion and blunted muscle fiber hypertrophy in response to PoWeR. (A) Representative IHC images from the soleus across all groups showing dystrophin (red) and nuclei (blue). (B) Myonuclear cell density in the soleus. (C) Myonuclear density in the plantaris. (D) Mean fiber CSA in the soleus. (E) Mean fiber CSA in the plantaris. Scale bar = 20 µm. Data are represented as mean ± SEM. Statistical analysis: two-way ANOVA with Tukey’s multiple comparisons test. (B) and (C) There was a main effect for PoWeR (P < 0.05) and satellite cell depletion (P < 0.001) in the soleus and a main effect for PoWeR (P < 0.01) and satellite cell depletion (P < 0.0001) in the plantaris. There was a significant interaction between PoWeR and satellite cell depletion in the soleus (P < 0.05) and plantaris (P < 0.05). (D) and (E) PoWeR led to higher muscle fiber CSA at 4-weeks (P < 0.0001) and 8-weeks (P < 0.0001) in the soleus and at 4-weeks (P < 0.05) and 8-weeks (P < 0.0001) in the plantaris. There was a significant effect for satellite cell depletion blunting this adaptation. *P < 0.05, †P < 0.05, ††P < 0.01.

