Fig. 1.
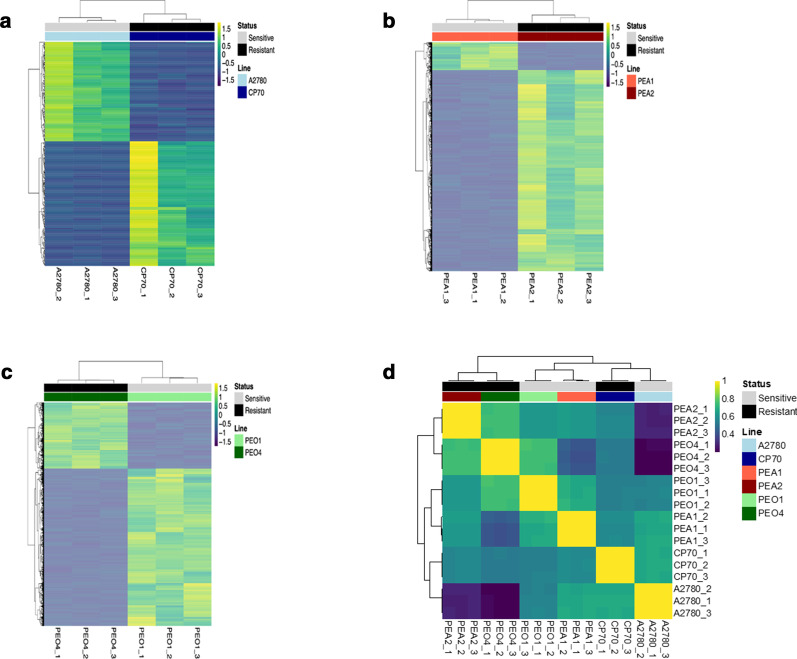
Correlation of ATAC-seq chromatin accessibility profiles across ovarian cancer cell lines. Heatmaps of ATAC-seq coverage in regions showing differential accessibility between the cisplatin-sensitive and cisplatin-resistant line in each pair. Each row is a 1-Kb window showing log2FC > ± 2 and FDR < 0.001. Dendrograms show similarity between samples as defined by unsupervised hierarchical clustering a A2780/CP70, b PEA1/PEA2, c PEO1/PEO4. d Heatmap of Spearman’s correlation coefficients for each experimental replicate for each cell line analyzed, based on all windows passing filter

