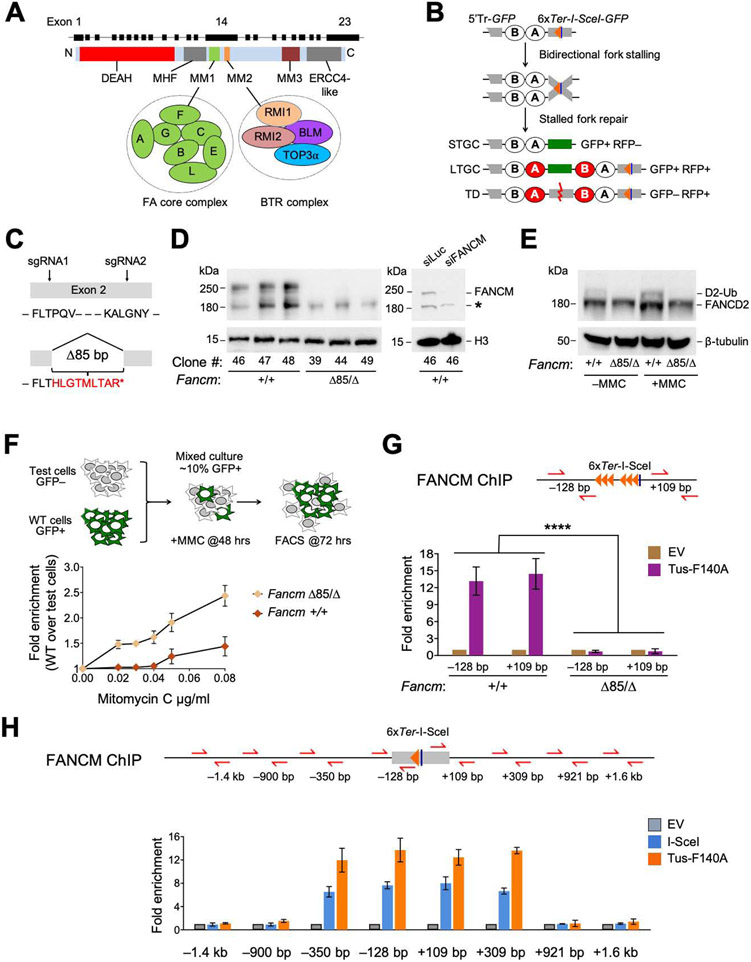
Figure 1. FANCM is recruited to Tus/Ter-stalled mammalian replication forks.
See also Figure S1. A. Cartoon of FANCM protein and gene structure. DEAH: helicase domain. B. 6xTer-HR reporter and repair products of Tus/Ter-induced fork stalling. Grey boxes: mutant GFP alleles. Orange triangle: 6xTer array. Blue line: I-SceI restriction site. Ovals A and B: artificial 5’ and 3’ RFP exons. Red ovals: wild type RFP-coding exons. STGC/LTGC: short/long tract gene conversion. TD: tandem duplication. Red zig-zag: non-homologous TD breakpoint. C. FancmΔ85 allele, showing frame-shift product with premature stop codon (*). D. Left panel: Immunoblot of chromatin-extracted FANCM in Fancm+/+ and FancmΔ85/Δ clones. H3: Histone H3 loading control. Right panel: loss of FANCM band in siFANCM-treated samples. siLuc: control siRNA to Luciferase. *: background band. E. Immunoblot showing FANCD2 ubiquitination in Fancm+/+ and FancmΔ85/Δ clones in presence or absence of MMC. β-tubulin: loading control. F. Proliferative competition assay in MMC, measuring enrichment of GFP+ Fancm+/+ vs. GFP− FancmΔ85/Δ cells. Data shows mean ± standard deviation (SD), n=3. Here and all subsequent growth assays, data normalized to 0 μg/mL MMC. G. ChIP analysis of FANCM at Tus/Ter. Cartoon shows qPCR primer positions for ChIP (red half-arrows; GFP sequence not shown). Numbers indicate distance in bp from outer primer to nearest edge of 6xTer array. Orange triangles: Ter sites. Blue line: I-SceI restriction site. Lower panel: FANCM ChIP 24 hours after transfection with empty vector (EV; gold) or Tus-F140A (purple). Data here and in all subsequent ChIP figures shows mean of 2−ΔΔCT values, normalized to EV and β-Actin control locus (see STAR methods). Data shows mean ± SD. Analysis by one-way ANOVA (n=3). In this and all subsequent figures: *: P < 0.05: **: P < 0.01; ***: P < 0.001; ****: P < 0.0001; ns: not significant. H. ChIP analysis of FANCM spreading at Tus/Ter or at I-SceI-induced DSB. Data shows mean ± SD (n=3).

