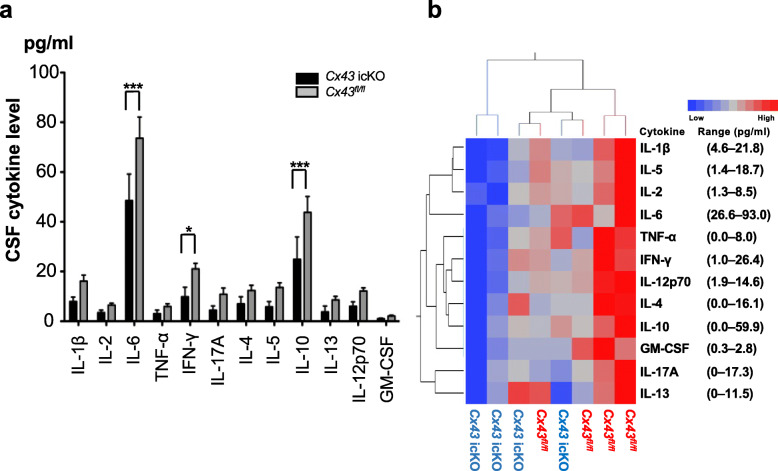
Fig. 7.
CSF cytokine levels in Cx43 icKO and Cx43fl/fl mice in the onset phase of EAE. a Mouse CSF was withdrawn from the foramen magna in the onset phase (dpi 10) of EAE and analyzed by a multiplexed fluorescence immunoassay. Each bar represents the mean cytokine level ± SEM (n = 3). Data were statistically analyzed by two-way ANOVA, followed by Sidak’s multiple comparison tests. *P < 0.05, ***P < 0.001. b Heat map of dual cluster analysis: cytokine levels and mice. A horizontal label represents individual mice. Cx43fl/fl mice are indicated in red and Cx43 icKO mice are indicated in blue. The ranges for measured cytokine levels are shown in parentheses. GM-CSF granulocyte-macrophage colony-stimulating factor, IFN interferon, IL interleukin, TNF tumor necrosis factor

