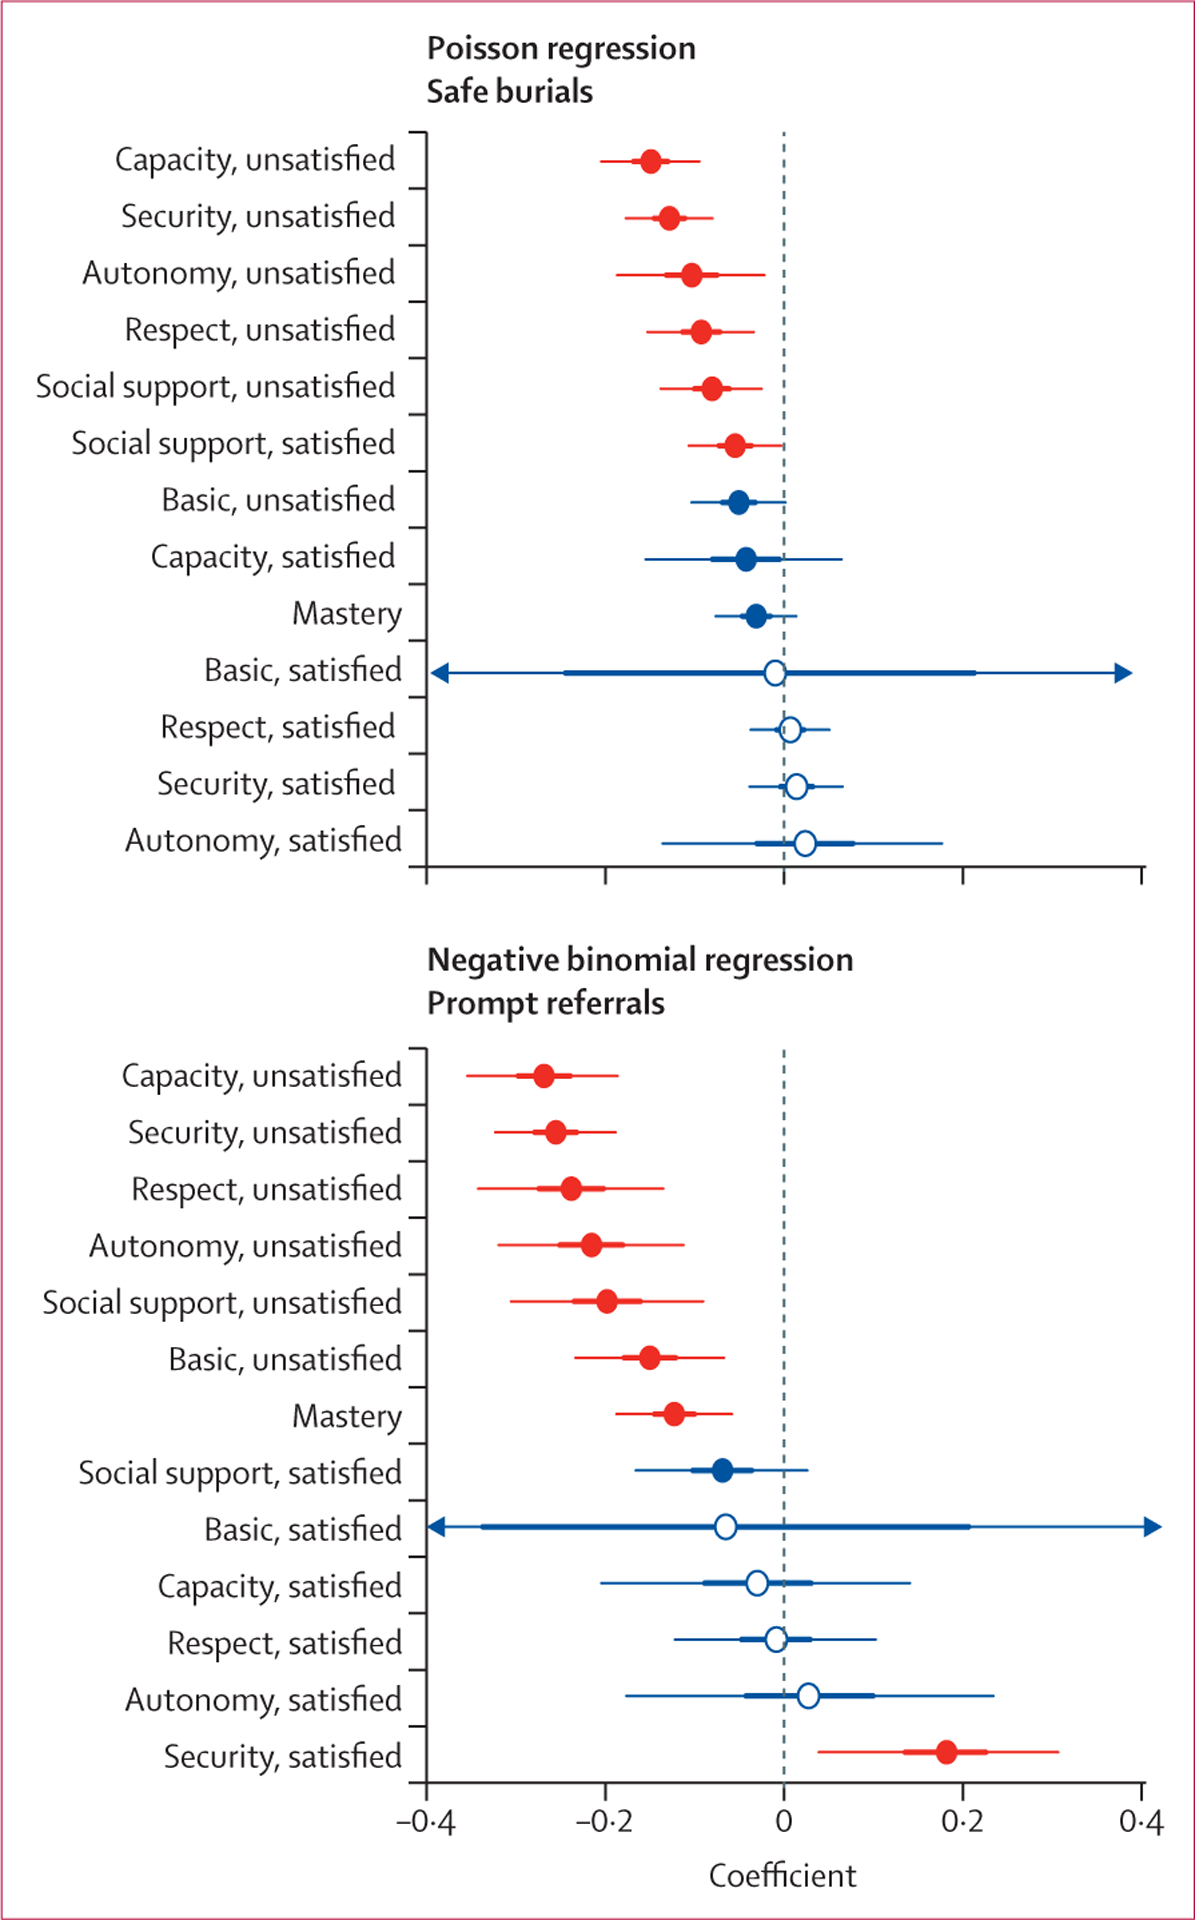
Figure 5: Posterior distributions for coefficients of Poisson regression of counts of safe burials and negative binomial regression of counts of prompt referrals to treatment within 24 h of symptom onset.

Thin and thick lines represent 95% and 50% credible intervals (CrIs), respectively. Parameters where 95% CrIs do not overlap 0 are indicated in red. Parameters where 95% or 50% CrIs overlap 0 are indicated in blue with closed or open circles, respectively. The CrIs around the coefficients for satisfied basic needs extend beyond the presented range for both outcomes.
