Figure 3.

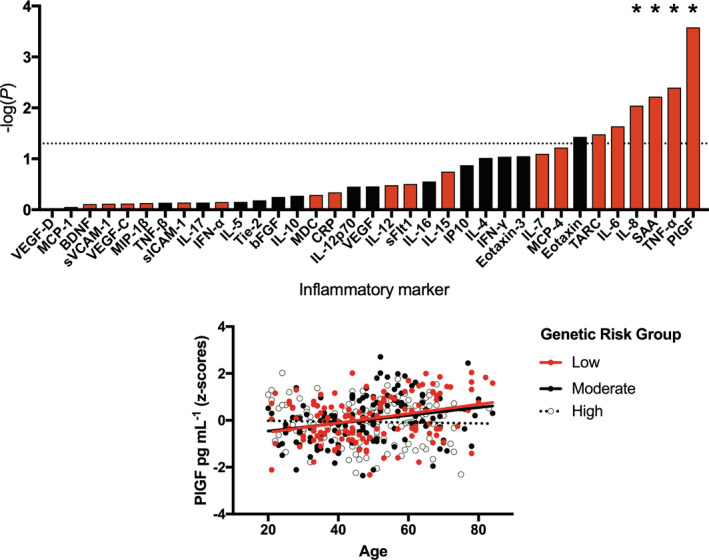
The interaction between genetic risk for severe coronavirus disease 2019 (COVID‐19) and age on inflammatory marker levels in a severe acute respiratory syndrome coronavirus 2‐negative cohort. Top: Results from linear regressions displayed as a bar plot. The interaction between genetic risk for severe COVID‐19 and age was tested in relation to inflammatory marker levels, with the strength of association represented by −log10(P), whereby taller bars represent higher levels of significance. Red bars correspond to a negative association (β), whereby older individuals with higher genetic risk have the lowest levels of an inflammatory marker, whereas black bars correspond to a positive association in which older individuals with higher genetic risk have higher levels of an inflammatory marker. The dashed line represents the nominal significance threshold (P < 0.05), *represents P FDR < 0.1. Bottom: A scatterplot demonstrating the interaction between age and genetic risk on blood levels of PIGF (corrected for cytokine assay batch, gender, body mass index, ethnicity and smoking status).
