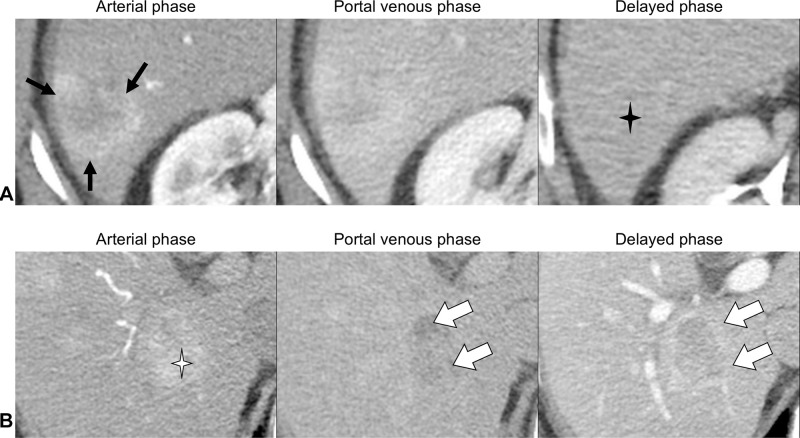
Figure 2.
Contrast-enhanced CT images.
Notes: (A) LR-M observation measuring 3.9 cm in segment VI showing targetoid morphology; rim arterial phase hyperenhancement (black arrows) and delayed central enhancement (black star). (B) LR-5 observation (definite HCC) measuring 3.5 cm in segment 6 showing APHE (white star), washout and capsule (white arrows).

