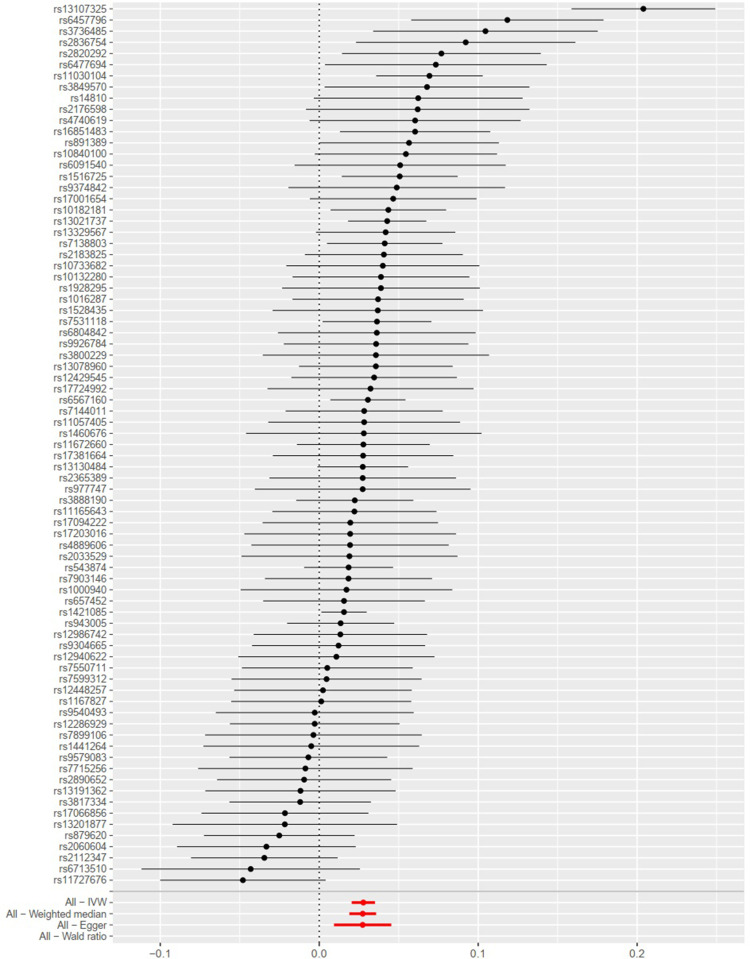
Figure 1.
Forest plot of single nucleotide polymorphisms (SNPs) associated with body mass index (BMI) and the risk of osteoarthritis. Black points represent the log odds ratio (OR) for osteoarthritis per standard deviation (SD) increase in BMI, which is produced by using each SNP selected as a separate instrument (rs1000940, rs10132280, rs1016287, rs10182181, rs10733682, rs10840100, rs11030104, rs11057405, rs11165643, rs11672660, rs1167827, rs11727676, rs12286929, rs12429545, rs12448257, rs12940622, rs12986742, rs13021737, rs13078960, rs13107325, rs13130484, rs13191362, rs13201877, rs13329567, rs1421085, rs1441264, rs1460676, rs14810, rs1516725, rs1528435, rs16851483, rs17001654, rs17066856, rs17094222, rs17203016, rs17381664, rs17724992, rs1928295, rs2033529, rs2060604, rs2112347, rs2176598, rs2183825, rs2365389, rs2820292, rs2836754, rs2890652, rs3736485, rs3800229, rs3817334, rs3849570, rs3888190, rs4740619, rs4889606, rs543874, rs6091540, rs6457796, rs6477694, rs6567160, rs657452, rs6713510, rs6804842, rs7138803, rs7144011, rs7531118, rs7550711, rs7599312, rs7715256, rs7899106, rs7903146, rs879620, rs891389, rs9304665, rs9374842, rs943005, rs9540493, rs9579083, rs977747, and rs9926784). Red points show the combined causal estimate using all SNPs together as a single instrument, using the three different methods (the inverse‐variance weighted (IVW) method, weighted median estimator, and MR‐Egger). Horizontal line segments denote 95% confidence intervals of the estimate.

