Figure 3.


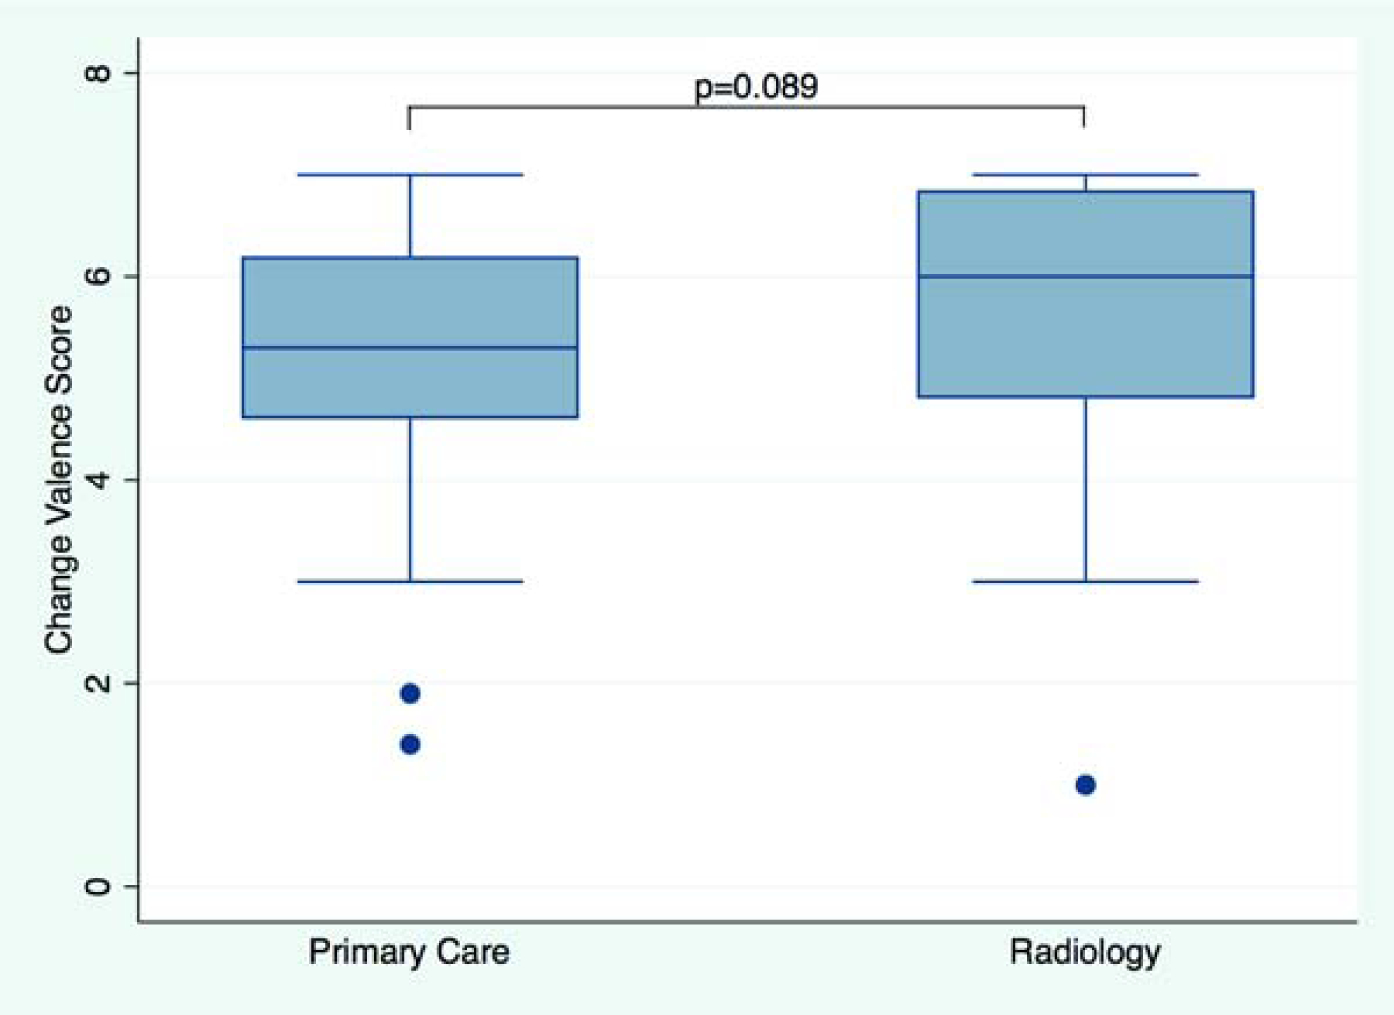
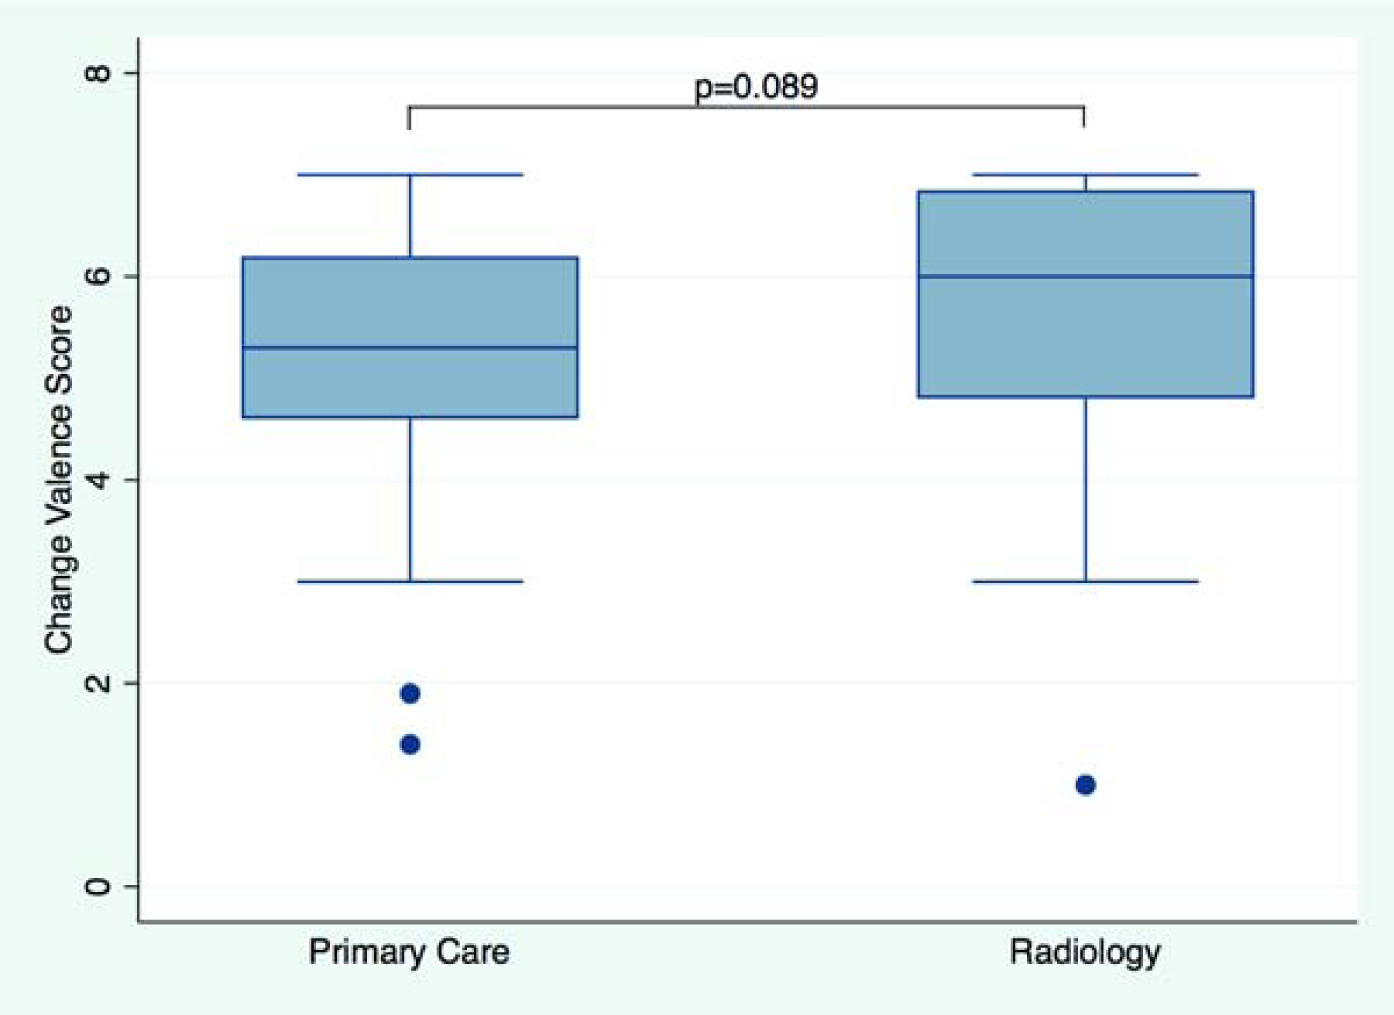
Change Valence. Boxplot shows change valence score by service line (Figure 3A) and in non-leaders vs. leaders (Figure 3B). Median scores and interquartile ranges (whiskers) are shown. P-value from unadjusted linear regression.


Change Valence. Boxplot shows change valence score by service line (Figure 3A) and in non-leaders vs. leaders (Figure 3B). Median scores and interquartile ranges (whiskers) are shown. P-value from unadjusted linear regression.