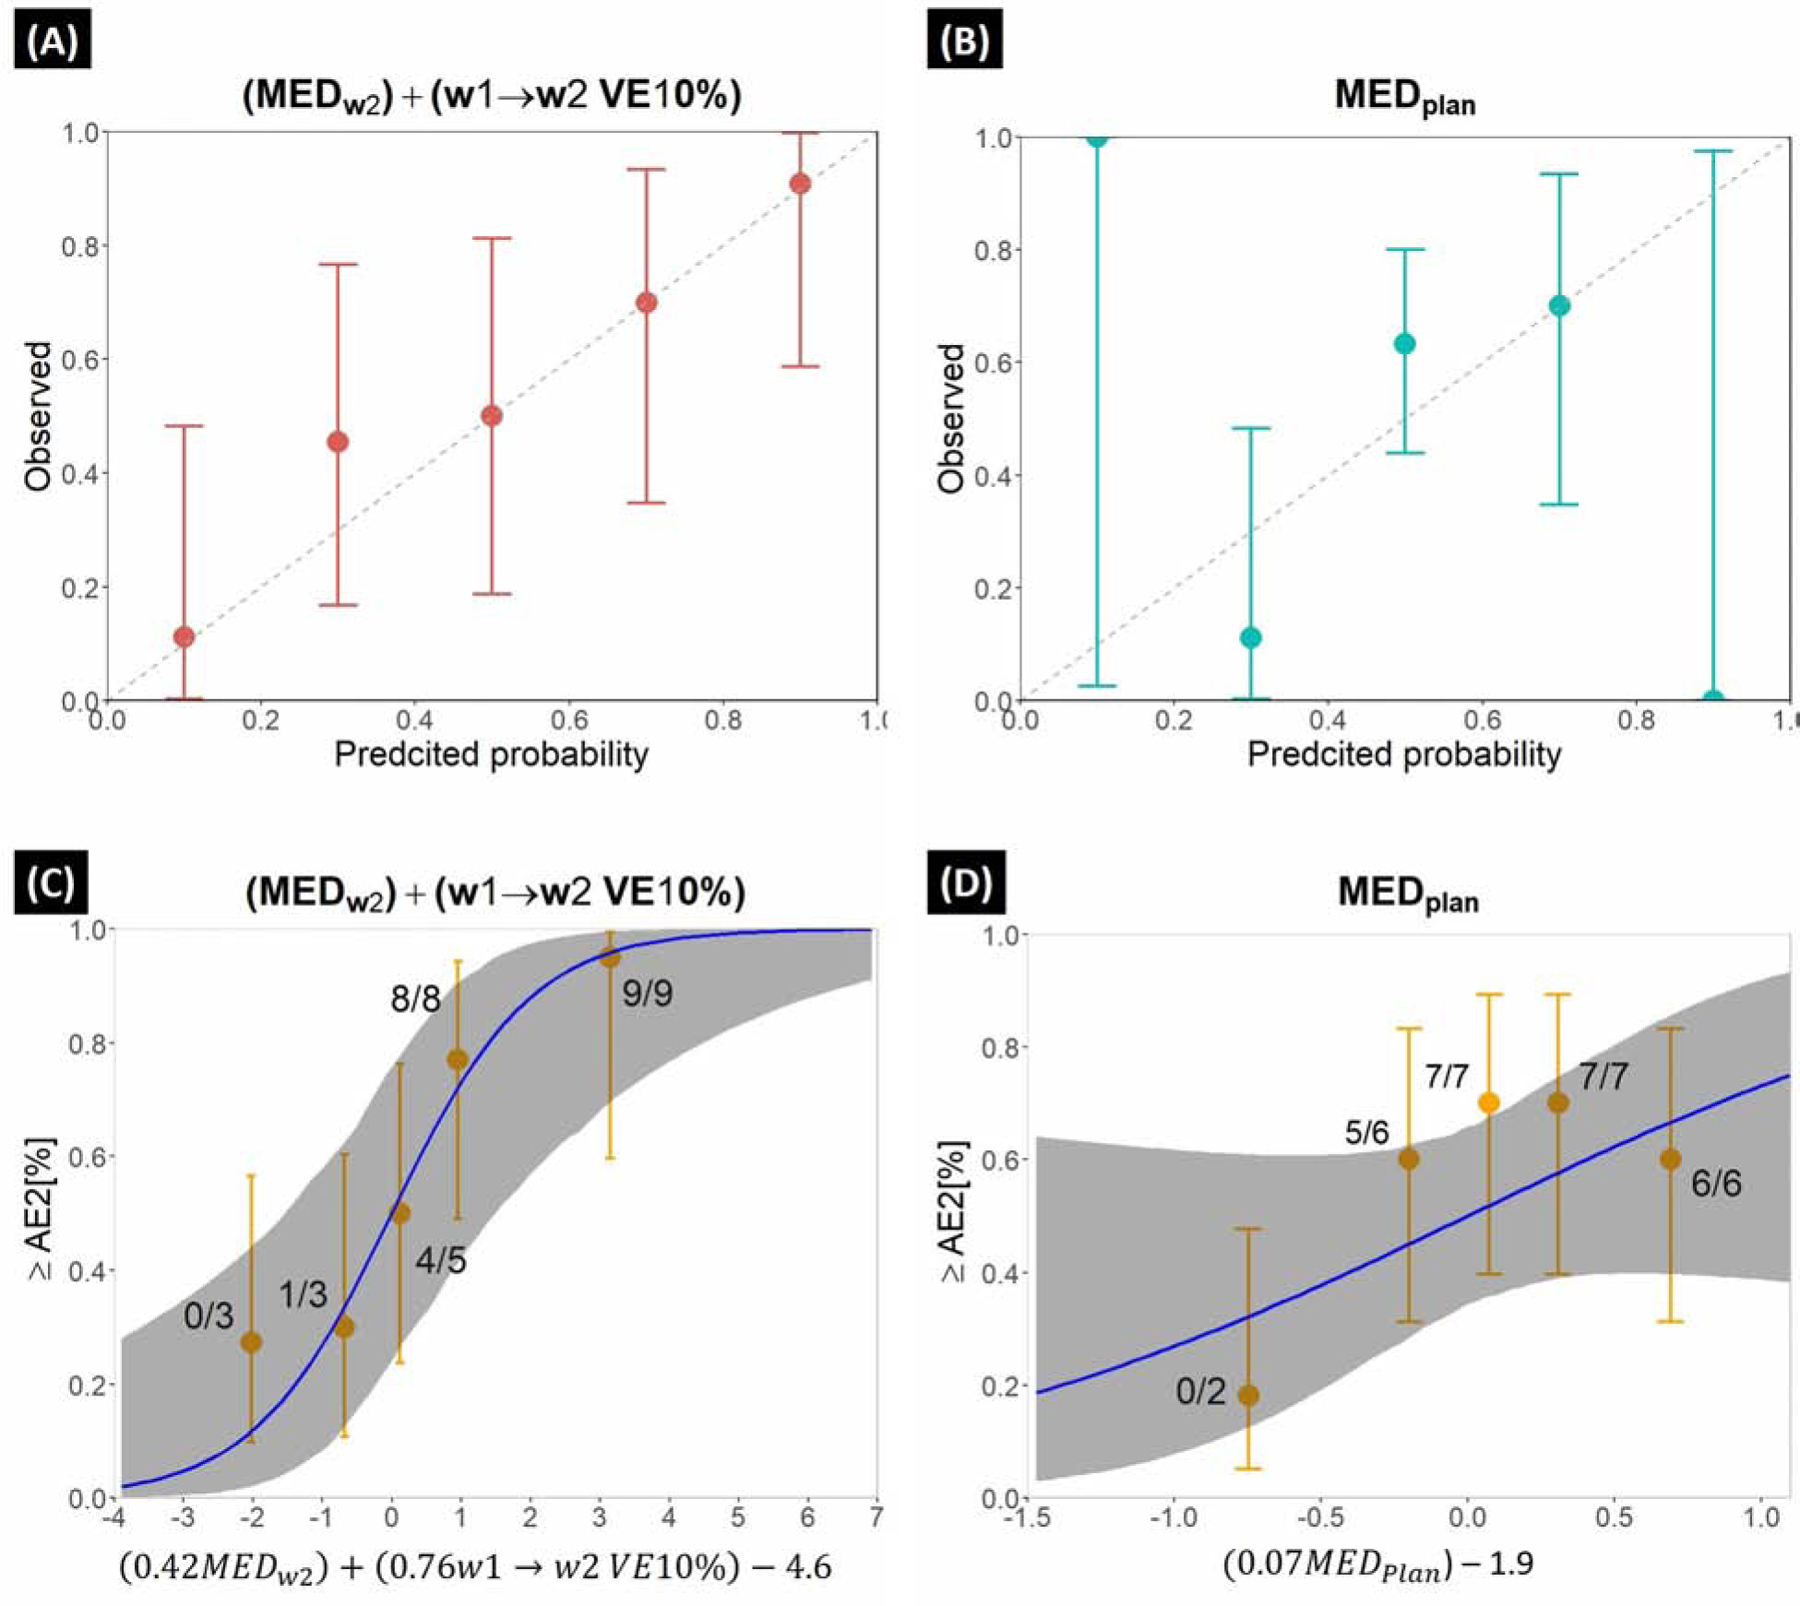
FIGURE. 2.

Calibration curves for the (A) proposed and (B) MEDplan model. Error bars denote 95% confidence interval. Dose-response curves for the (C) proposed and (D) MEDplan model where the dose-response predictions for ≥AE2 are given by the blue lines (gray ribbon is 95% CI). Orange quintiles denote observed ≥AE2 risk rate for each quintile (number of observed AE2/total number of patients) (error bars: 95% binomial confidence intervals); quintile-specific predicted/observed AE2 rates [%] are given above each quintile. ≥AE2 risk rate was calculated using the logistic function of [risk=1/1+exp(−x)] where x is the logistic regression argument (log-odds) for each model given below the dose-response curves.
