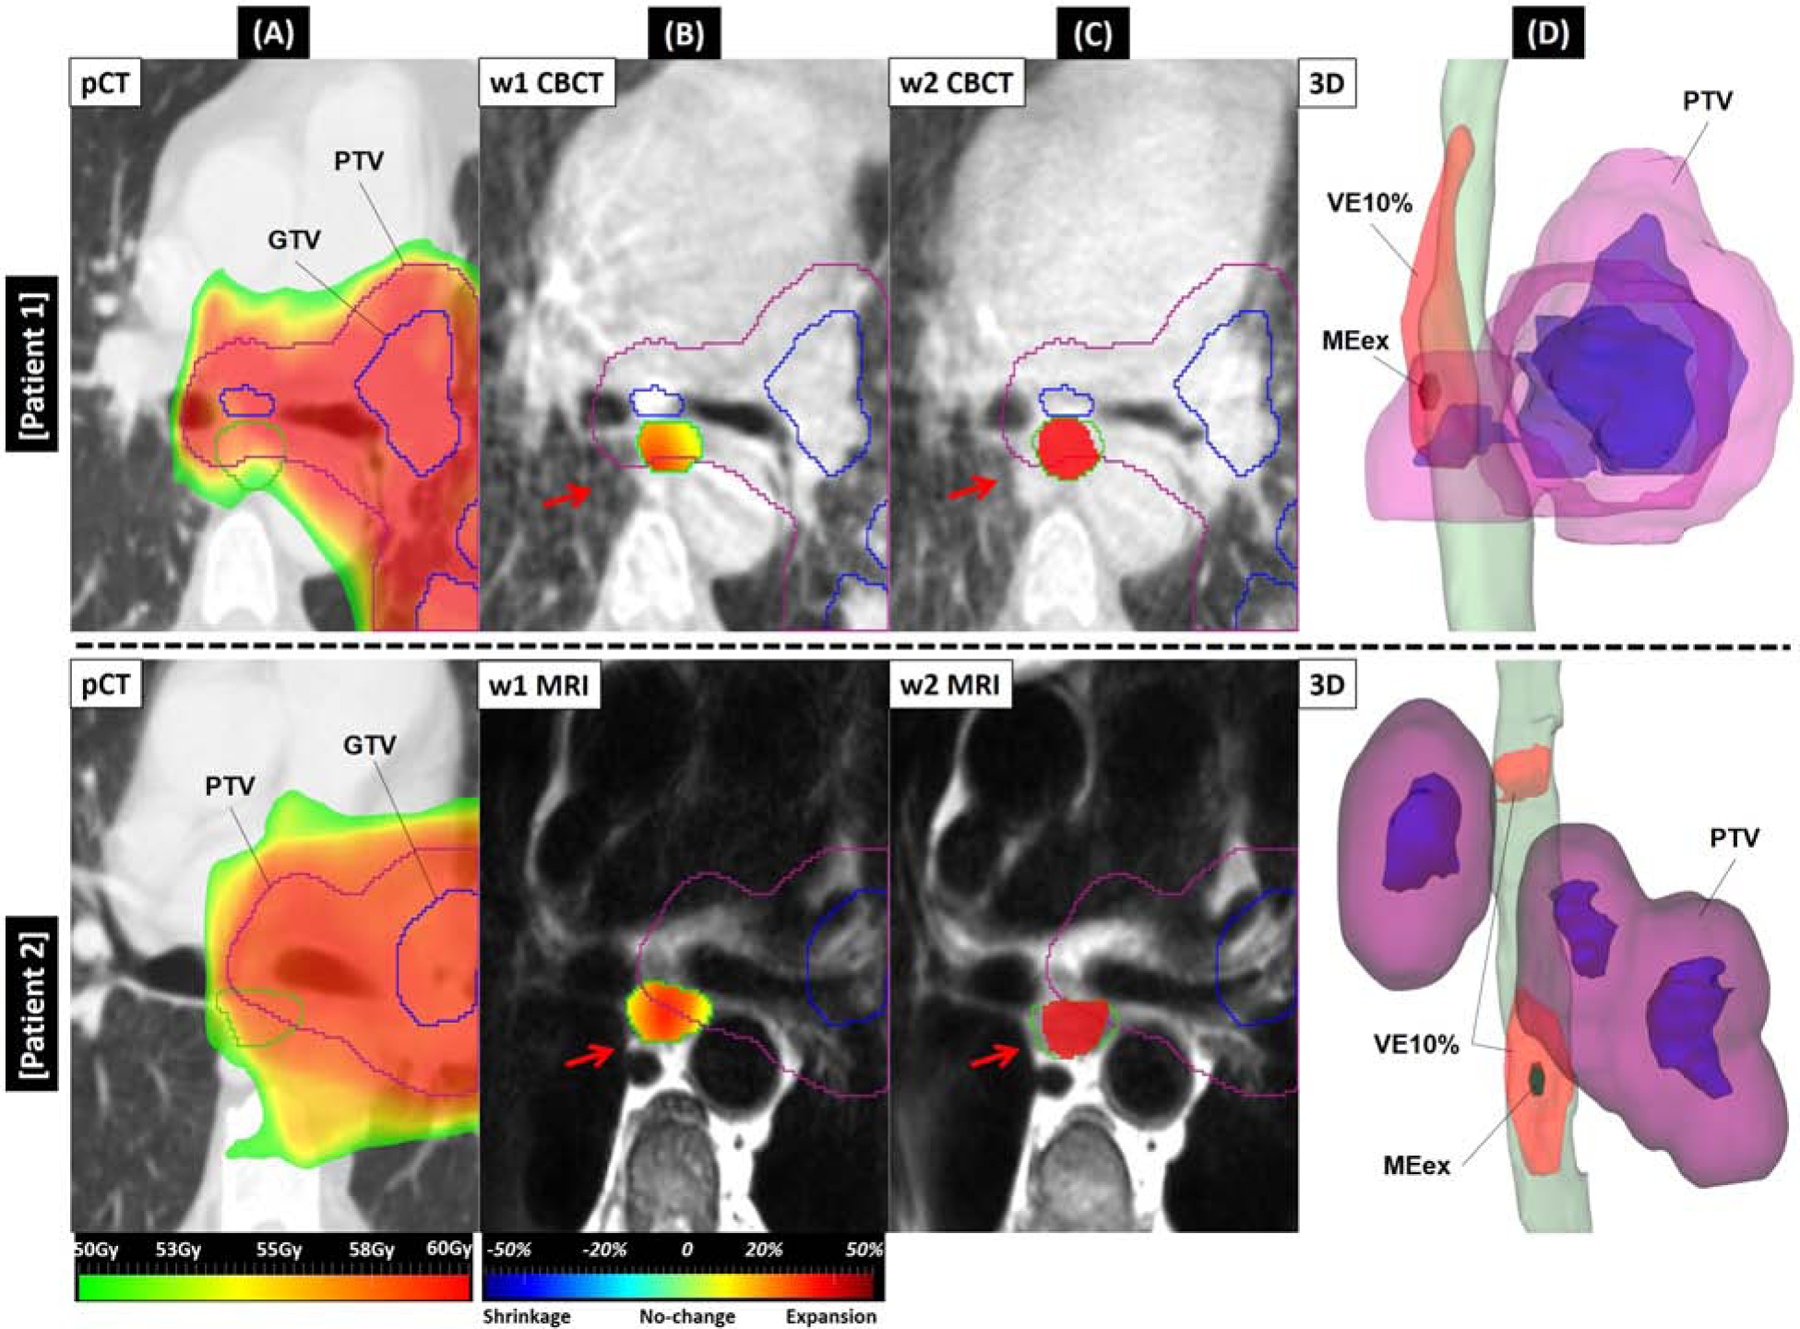
FIGURE. 4.

pCT, week1 and week2 images along with 3D view of w1→w2 expansions for two ≥AE2 cases from CBCT (top) and MRI (bottom) cohorts. (A) prescribed dose map overlaid on pCT. Green contour is the planning esophagus. (B) week1 CBCT/MRI. Green contour is ground-truth esophagus observed on week1. Red arrows depict expansion between week1 and week2 where Jacobian map inside the esophagus contour shows large expansion. (C) week2 CBCT/MRI. Green contour is esophagus on week2. Red filled color wash depicts w1→w2 VE10% inside the esophagus. (D) 3D view showing w1→w2 VE10% volume expanded (red structure) on week1 esophagus (green) and the small dark green structure inside VE10% is maximum esophagus expansion (MEex%). For each sub-figure, purple and blue contours are PTV and GTV, respectively.
