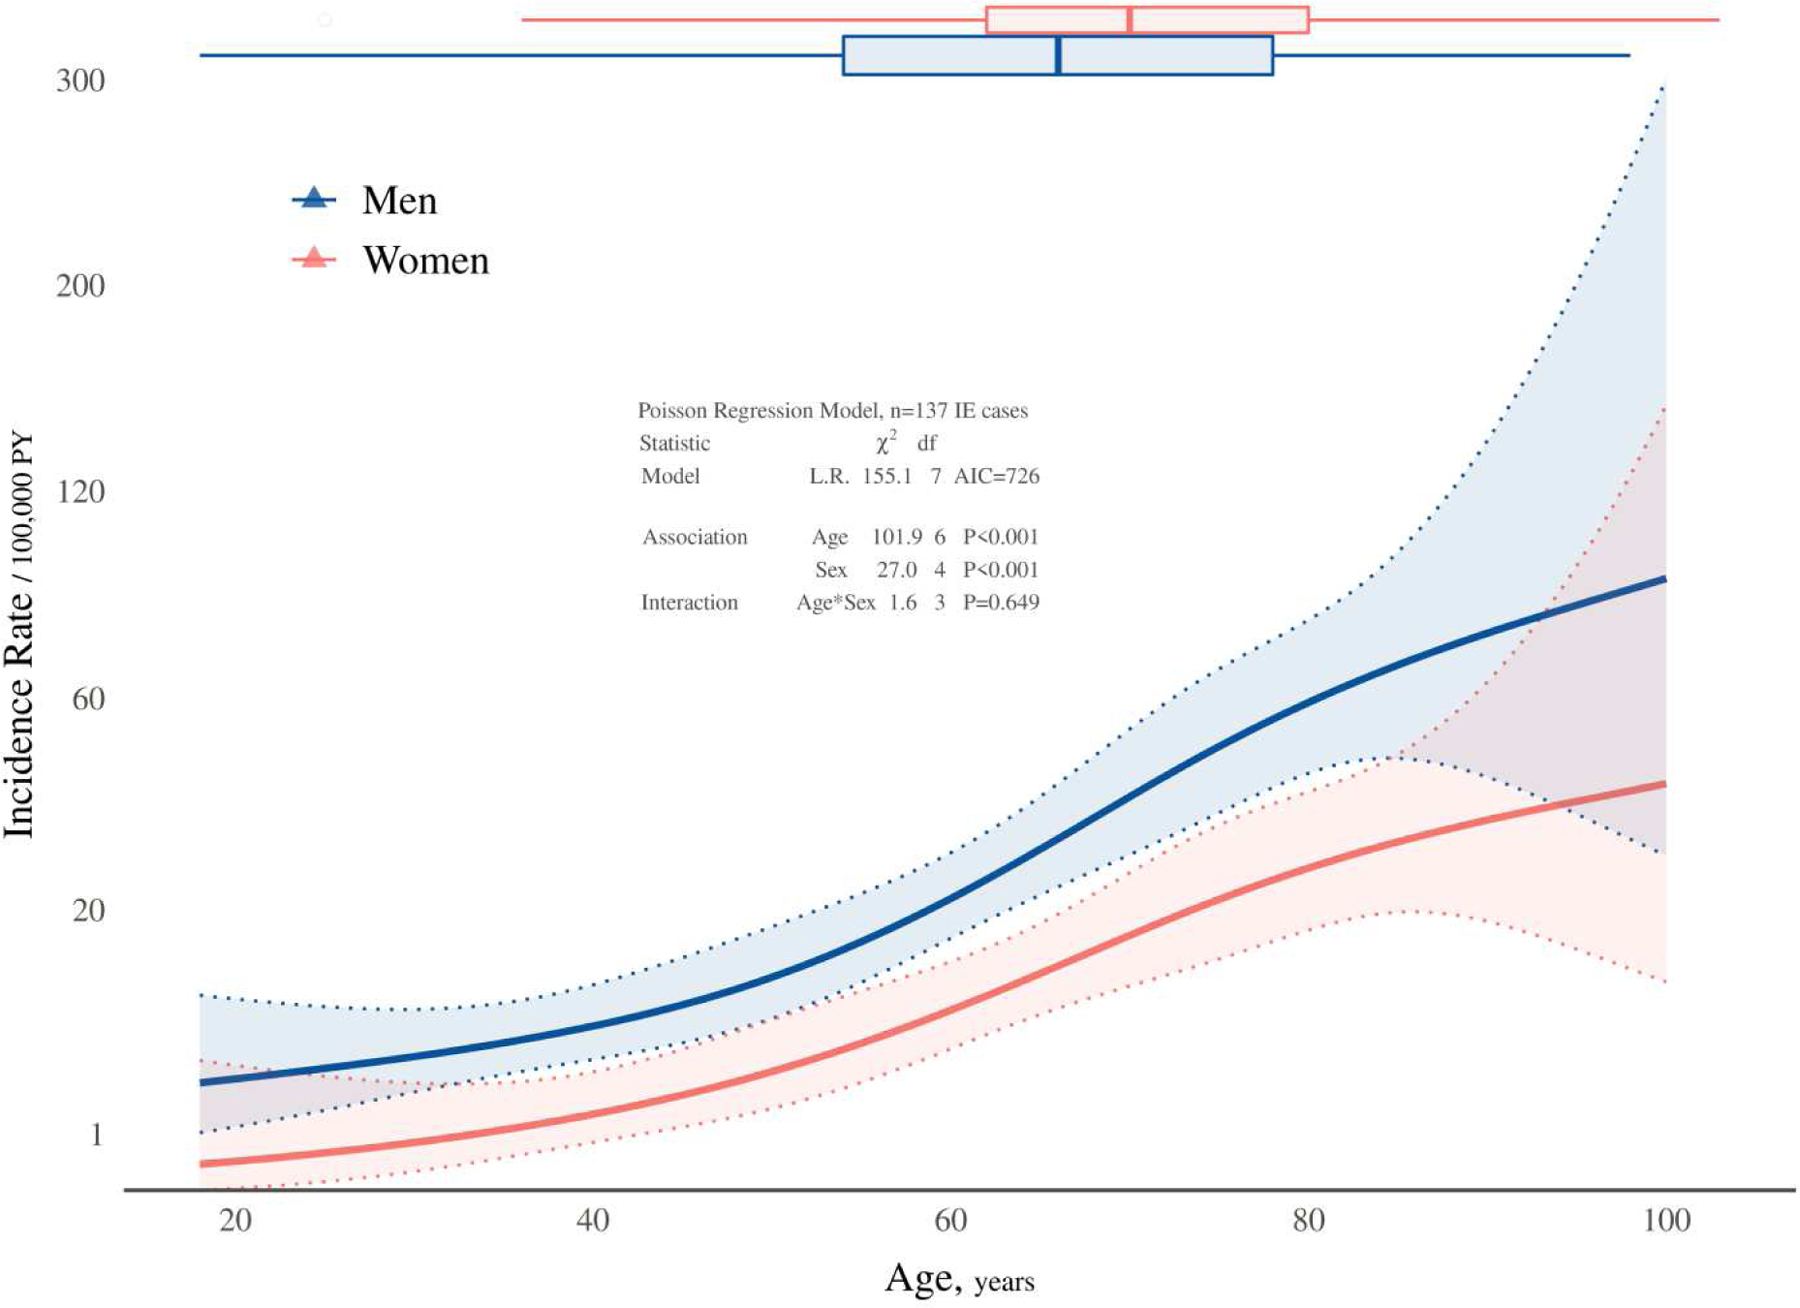
Figure 1.

IE incidence according to age and sex. Solid lines represent model-predicted incidence rates of IE as a function of age and sex, and shaded bands represent pointwise 95% confidence limits. Symbols in the plot are observed incidence rates stratified by sex and age categories to provide a crude verification of the model fit. Box plots at the top depict the age distribution of incident cases by sex.
