FIGURE 1.

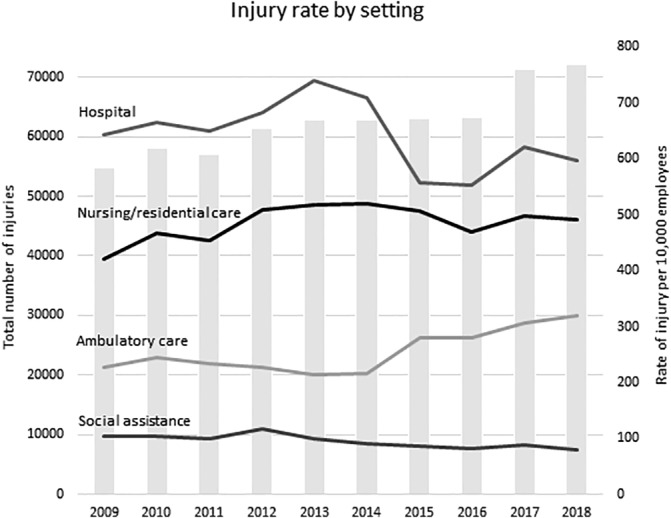
Total injury counts (gray bars, left axis) and rates of injury per 10 000 employees (trendlines, right axis) per year, across the four health care industry sub‐category settings

Total injury counts (gray bars, left axis) and rates of injury per 10 000 employees (trendlines, right axis) per year, across the four health care industry sub‐category settings