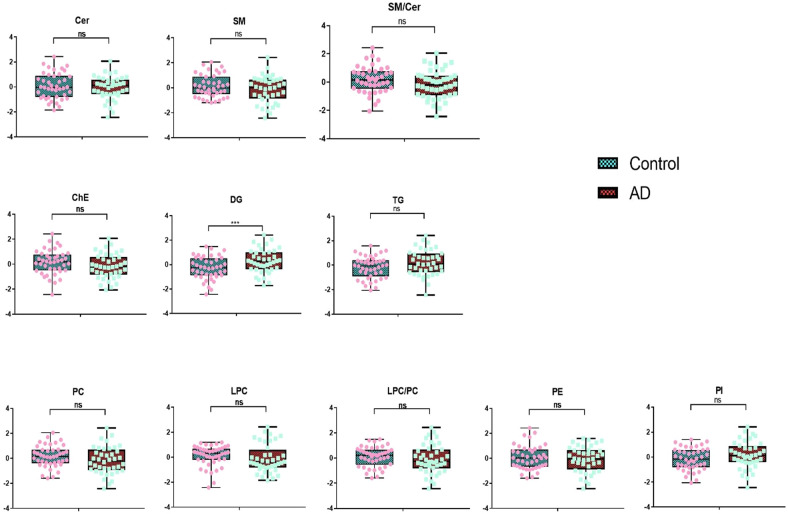
Fig. 3. Residuals of group lipids in AD and control group.
Cer ceramides, SM sphingomyelins, ChE cholesteryl esters, DG diglycerides, TG triglycerides, PC phosphatidylcholines, LPC lyso-phosphatidylcholines, PE phosphatidylethanolamines, PI phosphatidylinositols. Dots in the plot represent the residuals of group lipids in each participant. Residuals were obtained after regression out age, sex, BMI, diabetes status, hypertension status, medication status for hypertension, and hyperlipidemia, APOE e4 carrier status, education, and current smoking status. T-tests were used to compare the lipid differences between AD and controls. ns: no significance, *p < 0.05.

