

Abstract
Systemic cytokine concentrations have been extensively studied in implant-associated infections, providing sensitive diagnostic markers. However, less is known about the relationships of tissue-level cytokines surrounding the joint. The aim of this study was to define the cytokine profiles of tissues to investigate the use of these cytokines as markers of debridement in chronic joint infection. Using a rodent model, muscle samples were obtained from rats following Kirschner wire implantation and infection with Staphylococcus aureus to determine if: 1) differences exist in cytokine concentrations with proximity to infection, and 2) localized infection-specific markers can be identified on a tissue level to potentially serve as debridement markers in the future. Samples were collected from 4 distinct locations, and the concentrations of IL-1α, IL-1β, IL-4, IL-5, IL-6, IL-10, IL-12p70, IL-13, GM-CSF, IFN-γ, and TNF-α were quantified in each sample, relative to the amount of tissue. Cytokine concentrations differed with proximity to the joint when implant or infection was present, and tissues at the operative knee joint showed the highest levels of most cytokines. Additionally, IL-1β, IL-4, and IL-6 showed promise, beyond diagnostics, as tissue-level indicators of infection response. Ultimately, this study illustrated that tissue-level evaluation provided insight into infection-specific response, and these markers may be useful for guiding debridement of implant-associated infections.
Keywords: Chronic Joint Infection, Arthroplasty, Inflammation, Interleukin, Spatial Distribution
1. Introduction
Implant-associated infections are a post-operative complication following total knee arthroplasty (TKA) procedures, affecting tens of thousands of patients per year in the United States.1 Prosthesis-related infections affect the implant and surrounding tissues, and they can become chronic if bacteria form a biofilm on the prosthesis, creating a barrier against host response and antibiotic treatment.2 This pressure on the host’s immune system combined with antibiotic resistance of the bacteria makes these infections difficult to reconcile and often results in high failure rates for treatment. Failure rates for all TKA procedures remain around 5% but are much higher with infected joints, with reported failure rates ranging from 14–25%.3–5
Early diagnosis of infection is critical, and a range of sensitive and specific biomarkers, including C-reactive protein (CRP), alpha-defensin, D-dimer, as well as cytokines like interleukin (IL)-1β, and IL-6, have been highlighted for their diagnostic utility in implant-associated infections.6–9 Cultures, biopsies, and imaging techniques like PET-MRI and PET-CT have also been utilized with high sensitivity.10 Prompt diagnosis can lead to better outcomes in surgical treatment, and serum biomarkers are most often used to aid diagnostic accuracy.11 CRP is the most common diagnostic marker for implant infections, as it is both inexpensive and rapid12, however, it suffers from low specificity. CRP levels can be high in a wide range of inflammatory processes, including the healing process following TKA procedures13, so a high CRP level alone cannot positively confirm presence of infection. More recently, diagnostic efforts have shifted towards the identification and validation of cytokine markers. The cytokine response to infection involves both pro- and anti-inflammatory cytokines that are recruited to the site.14–16 Due to cytokines’ central roles in infection response, recent studies have investigated cytokine measurements for their diagnostic utility, especially in infections due to Staphylococcus aureus, the most common pathogen implicated in implant-associated infections. Pro-inflammatory cytokines IL-6, IL-1β, and tumor necrosis factor alpha (TNF-α) were first analyzed in synovial fluid of total hip arthroplasty (THA) patients and showed the ability to discriminate between aseptic and septic joints.17 Since then, a variety of other cytokines, including interferon gamma (IFN-γ)18, IL-419, and IL-10 have also been pursued.20 Frangiamore et al. identified IL-6 and IL-1β not only as markers with excellent diagnostic strength, but also noted their efficacy for monitoring response to infection treatment in synovial fluid.18 While these cytokines have shown increased sensitivity and specificity for diagnosis in serum and synovial fluid, they have not been evaluated to expand their use beyond diagnostics into indicators of inflammatory immune response to aid treatment.
Surgical debridement is utilized to treat chronic implant infections, but it relies heavily on subjective assessment of the state of the tissues surrounding the joint.21 Understanding local tissue health is important for debridement of infected joints, as surgeons must delineate healthy from non-healthy tissue to promote infection resolution.22 Complete removal of infected tissue is critical, as re-infection only requires a small number of bacteria.23 Discerning healthy tissue from infected tissue can be challenging for clinicians, and insufficient debridement is a possible source for failure of treatment.24 However, tissues are not intra-operatively analyzed beyond identification of the “4 C’s”- Color, Consistency, Contractility, and Capacity to bleed- and quantification of white blood cells. Rarely, the presence or absence of bacteria via culture or polymerase chain reaction (PCR) is utilized.17, 25 Intra-operative assessment of tissues surrounding the joint for inflammatory cytokine markers could reveal important insights into tissue health, as these biomarkers are intimately related to infection response6–8, 26 and wound resolution.27 Further, identification of markers to guide debridement would benefit clinical decision making and allow surgeons to quantitatively assess the state of tissue in infected joints. Cytokine biomarkers that have previously been utilized for their roles in diagnostics may provide an avenue to pursue quantitative markers of debridement margins. Defining the tissue-level concentrations is the first step to evaluating the ability of cytokines as markers of healthy and non-healthy tissue in chronic implant-associated joint infection.
The purpose of this study was to assess tissue-level cytokine responses in a rodent model of chronic implant-associated infection. Cytokine concentrations were measured in skeletal muscle samples taken from Sprague-Dawley rats implanted with a Kirschner wire (K-wire) and exposed to S. aureus in the joint cavity. Levels of pro-inflammatory and anti-inflammatory cytokines were measured for the following targets: IL-1α, IL-1β, IL-4, IL-5, IL-6, IL-10, IL-12p70, IL-13, IFN-γ, TNF-α, and granulocyte-macrophage colony-stimulating factor (GM-CSF). These factors were specifically chosen because of their use as diagnostic markers28, roles in tissue healing27, and the ability to give insight into overall tissue health.29 Ultimately, this study aimed to expand on the diagnostic roles of these cytokines and investigate them as markers of debridement margins.
2. Materials and Methods
2.1. Animals
All procedures were performed under the guidelines approved by the West Virginia University Animal Care and Use Committee (Approval #1803013294). Adult male and female Sprague-Dawley rats (Charles River, Wilmington, MA) were housed individually with a 12:12 light/dark cycle and ad libitum access to standard chow and water. Animals were divided into 3 groups: Sham (N=6), Implant Only (N=6), and Infection+Implant (Inf+Implant; N=6). Animal numbers for each group were obtained by performing a statistical power analysis using an alpha value of 0.05 and a difference to detect of 2. The power analysis was based on previous work to detect trauma-related cytokines, specifically IL-1β.30 The power analysis necessitated a group size of N=6 when including both male and female rodents. All procedures were based on previous models of implant-associated infections in rats with K-wire implant,31–35 and tissues and blood were collected from all animals 21 days post-surgery.
2.2. Experimental Rat Model of Localized Infection
Chronic joint infection was established based on literature protocols and previous work. Briefly, after adequate isoflurane anesthesia, the right leg was shaved and prepared for surgery. Under sterile conditions, the knee joint was exposed, and a hole was drilled into the medullary cavity of the femur. For Implant Only and Inf+Implant groups, a 3-cm (male) or 2-cm (female) by 1-mm stainless steel K-wire was implanted into the bone. For Inf+Implant groups, 20 μL of 1.8×10⁷ CFU/mL suspension of Methicillin-sensitive Staphylococcus aureus (MSSA; ATCC 25923, clinical isolate [Manassas, VA]) was injected into the medullary cavity after insertion of K-wire. This dose was chosen based on previous models to create a chronic localized infection but to avoid systemic sepsis.36 Additionally, a previous study found that inflammation due to surgery can persist until the 21-day time point, so this time point was chosen for tissue collection to optimize the measurement of infection-specific inflammatory cytokine responses.36 Body temperature was monitored throughout the 21-day time period for presence of fever to ensure no systemic sepsis occurred. For all groups, the exposed joint was closed with 3–0 vicryl (Ethicon, Inc., Somerville, NJ) and staples, then Vetbond tissue adhesive (3M, St. Paul, MN) was applied externally. Buprenorphine SR (ZooPharm, Fort Collins, CO) was administered subcutaneously as an analgesic providing 72-hour pain relief.37 Following closure of the knee joint, X-rays were taken at the 21-day time point and graded according to Aktekin et al.38 Detailed methods and results for X-rays can be found in the Supplementary Information.
2.3. Tissue Collection
At 21-days post-surgery, the animals were again placed under anesthesia, as described above, and tissue and blood samples were collected. The 21-day post-surgery time point was chosen for sample collection as it allowed for the local effects in bone and soft tissue.31, 33, 36 Once samples were collected, the animals were euthanized under isoflurane anesthesia with cardiac puncture, and one cc of Euthasol (Patterson Veterinary, Greenly, CO) was administered. Blood was collected in BD Vacutainer SST collection tubes (Becton Dickinson Vacutainer, Franklin Lakes, NJ), and serum was separated per manufacturer’s instructions. Blood samples were tested for white blood cell count (WBC) and red blood cell count (RBC) via standard medical lab testing; CRP (Invitrogen, Carlsbad, CA) and IL-6 levels (Invitrogen) were tested via enzyme-linked immunosorbent assay (ELISA) in serum. These systemic measurement parameters can be found in Table 1. For tissue collection, four tissue locations were gently dissected from fascial attachments, and skeletal muscle was collected. These locations were chosen to compare tissue-level cytokines directly at the infected joint to nearby locations to evaluate infection-specific tissue responses across spatial gradients. Muscle samples were harvested from the following four locations: at the operative knee joint; 1.5±0.2 cm proximal from operative knee joint; 1.0±0.2 cm distal from operative knee joint; and from the contralateral leg knee joint. Figure 1 illustrates the sampling locations, labeled as A-D. Tissue samples were cultured to confirm presence or absence of S. aureus infection at 21 days post-surgery using established methods.39 Bacterial load at the operative knee location for the three groups can be found in Table 1.
Table 1.
Clinically-Relevant Parameters at 21 Days Post-Surgery. At 21 days post-surgery, blood was collected and tested for RBC and WBC; IL-6 and CRP were measured in rat serum. Additionally, skeletal muscle samples were cultured to calculate bacterial load at the joint. RBC are shown in scientific notation as million(s) per microliter of blood; similarly, WBC are shown as thousand(s) per microliter of blood. CRP is shown in milligrams of CRP per liter of serum, and IL-6 is shown as picograms of protein per milliliter of serum. Bacterial load is shown as colony-forming units (CFUs) per gram of tissue. Significance at p<0.05 is denoted with superscripts “S” for different than Sham, “C” for different than Implant Only, and “I” for different than Inf+Implant. Comparisons between groups were identified by one-way ANOVA with Tukey’s post-test. N.D. is an abbreviation for “not detected.”
| SHAM | IMPLANT ONLY | INF+IMPLANT | |
|---|---|---|---|
| RBC (x106/μL) | 8.14±0.53 | 7.98±0.54 | 7.69±0.60 |
| WBC (x103/μL) | 3.97±0.78 | 2.90±2.14 | 3.63±1.40 |
| CRP (mg/L) | 428.51±164.92 | 620.24±296.11 | 789.39±181.20 |
| IL-6 (pg/mL) | 24.50±0.69C,I | 68.18±15.94S | 118.06±13.50S |
| Bacterial load (CFU/g)* | N.D. | N.D. | 1.12×10⁶±6.58×10⁵ |
Note: Bacterial load was calculated in tissue cultures, while all other parameters in Table 1 were measured in serum.
Figure 1.
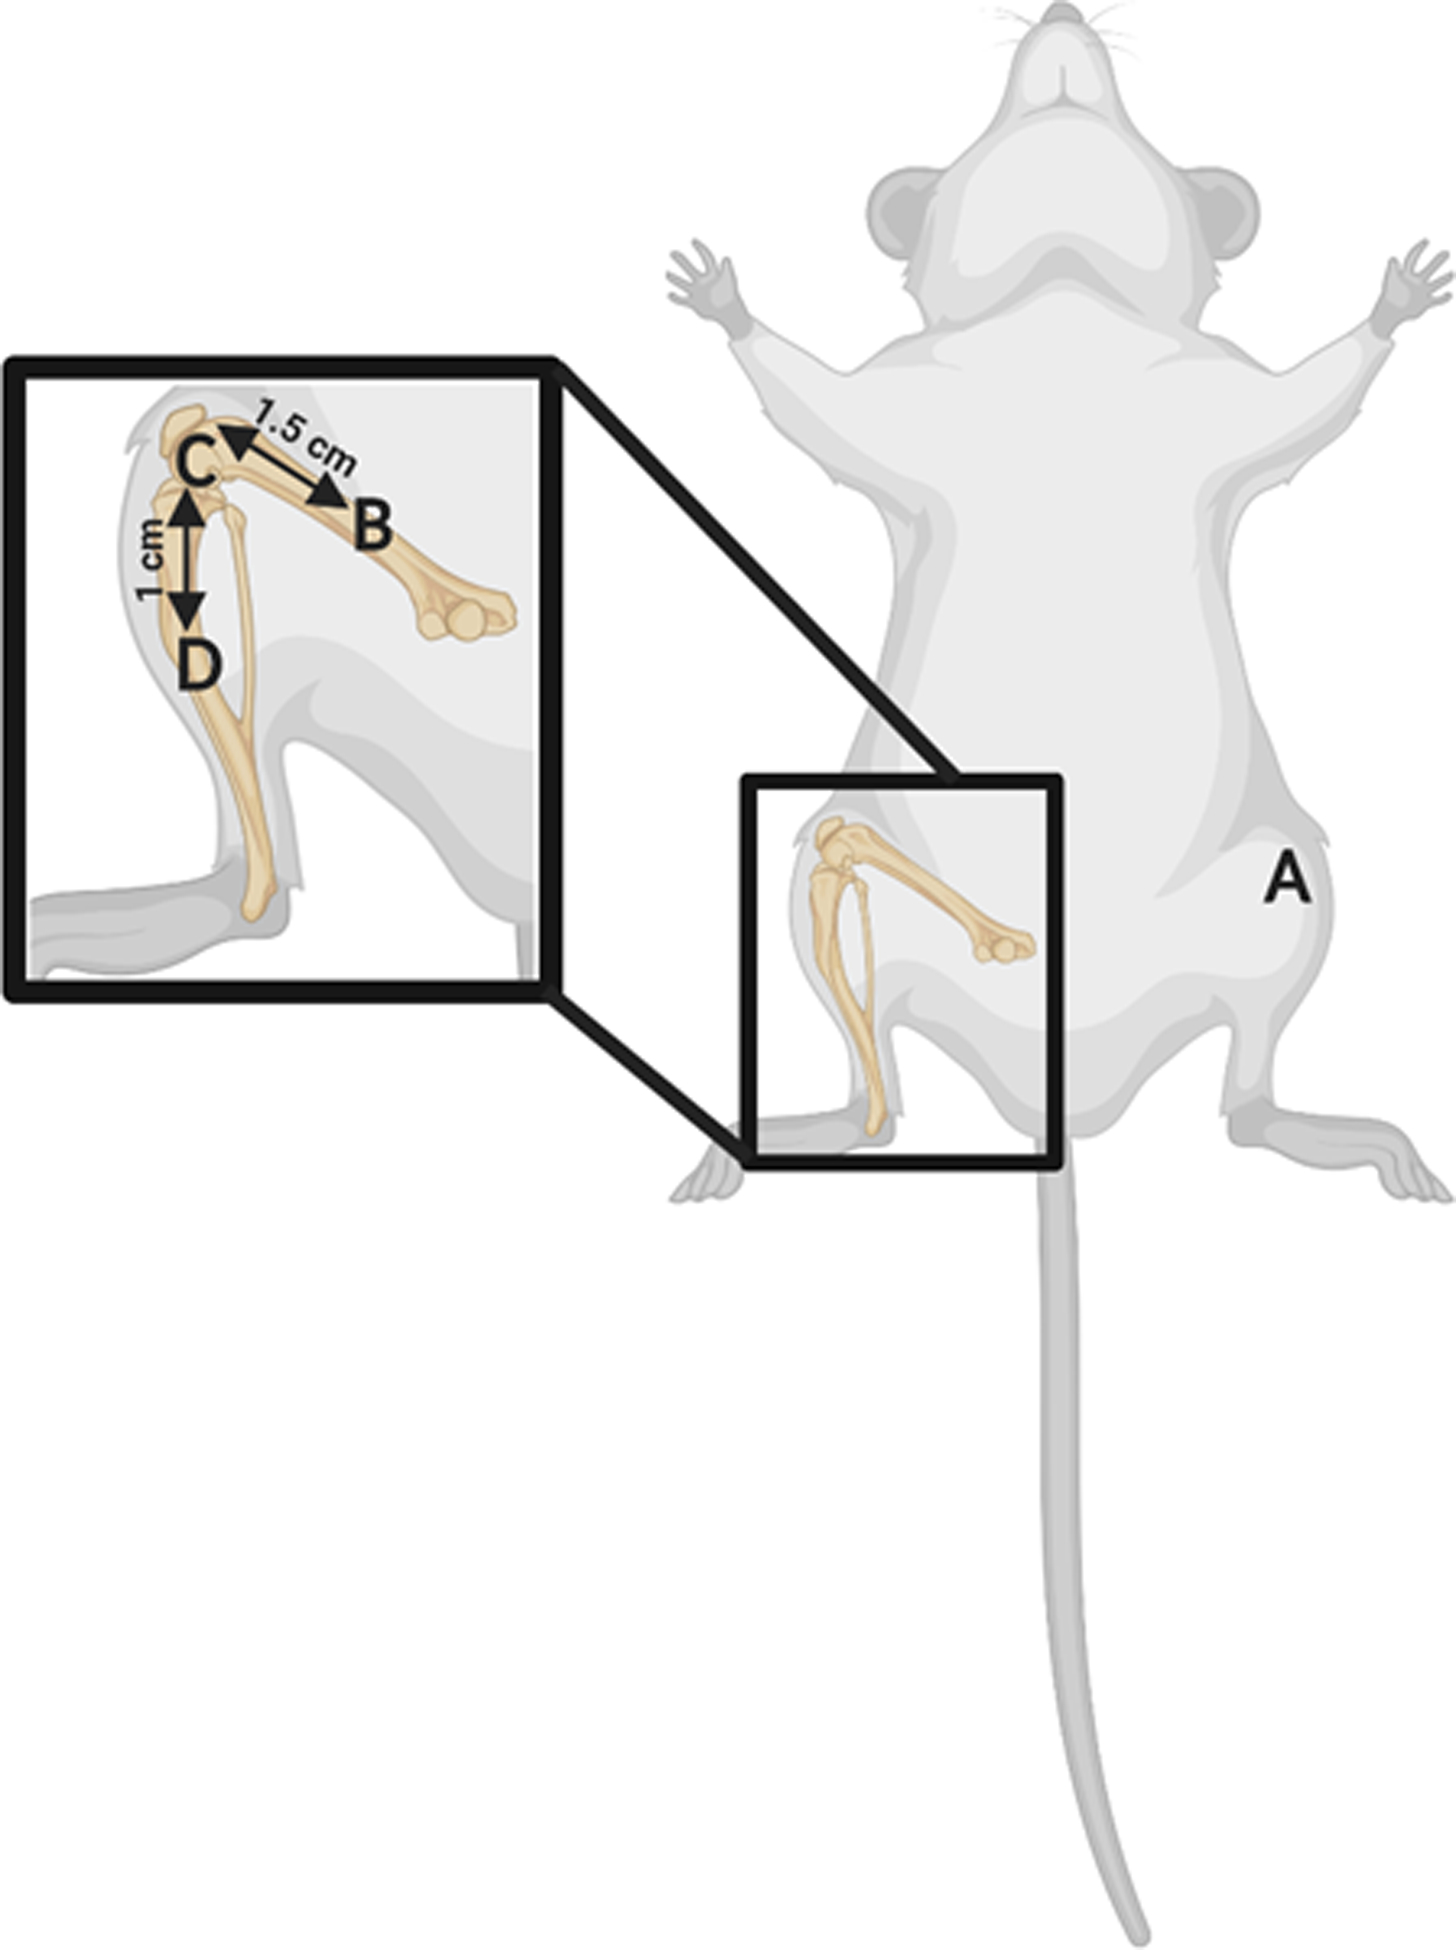
Sampling locations for muscle samples collected at 21 days post-surgery. Immediately prior to euthanasia, tissue samples were collected by gently dissecting skeletal muscle from fascial attachments. Four tissue locations were taken, denoted A-D. A) Contralateral leg knee joint; B) Operative leg, 1.5 cm proximal from knee joint; C) Operative leg knee joint; D) Operative leg, 1.0 distal from knee joint.
2.4. Sample Preparation
Samples were washed immediately with 1X cold phosphate-buffered saline (PBS) to remove blood and debris. Tissues were grossly dissected using a scalpel to remove scar and connective tissue, then stored at −80°C. Samples were ground cryogenically and lyophilized for 24 hours. For analysis, lyophilized tissue was thawed for 10 min at 4°C in 1 mL of cell lysis buffer (Bio-Rad, Hercules, CA) containing 20 mM phenylmethylsulfonyl fluoride (Sigma-Aldrich, St. Louis, MO). Protein extraction was performed using methods adapted from Hulse et al.40 Thawed samples were vortexed for 1–3 seconds and centrifuged at 5,000 × g for 5 minutes at 4°C. The supernatant was collected and tested for total protein content using a Pierce BCA Protein Assay Kit (Thermo Scientific, Waltham, MA), according to manufacturer’s instructions. Absorbance values for total protein content were determined on an Infinite M1000 multimode plate reader (Tecan, Raleigh, NC).
2.5. Cytokine Measurement
To standardize samples for total protein content, tissue homogenates were individually diluted to a total protein concentration of 900 μg/mL with cell lysis buffer (Bio-Rad). Cytokine quantification was performed using a magnetic bead-based multiplex Rat Cytokine Th1/Th2 Kit (Bio-Rad) and measured using a Bio-Plex 200 suspension array system and Pro II Wash Station (Bio-Rad), according to the manufacturer’s instructions. The Th1/Th2 kit included the following cytokines: IL-1α, IL-1β, IL-4, IL-5, IL-6, IL-10, IL-12p70, IL-13, GM-CSF, IFN-γ, and TNF-α. Results for these 11 cytokines were included in this analysis.
2.6. Statistical Analysis
Data were analyzed using Prism 5 (GraphPad, San Diego, CA) and SAS JMP (Cary, NC). Standard curves for cytokine concentrations were generated for each protein using either a four- (4PL) or five-parameter logistic (5PL) regression model, depending on individual protein. Cytokine concentrations were determined using standard curve interpolation, then corrected by dilution factor. To compare cytokines, these values were standardized by tissue weight and converted to nanograms of cytokine per gram of tissue (ng/g). Samples with fluorescence intensity values below the lower limit of quantitation (LLOQ) or above the upper limit of quantitation (ULOQ) were omitted from statistical comparisons. Outliers were identified using the 1.5 × interquartile range (IQR) rule and omitted from analysis. Two-way analysis of variance (ANOVA) with Bonferroni’s post-test was used to determine significant differences between Sham, Implant Only, and Inf+Implant groups as well as between locations (i.e., in the Sham group, operative knee joint vs. operative leg proximal). Each tissue homogenate was tested in duplicate for cytokine concentration. Data are expressed as the mean ± standard error of the mean (SEM).
2.7. Quadratic Discriminant Analysis and Heat Maps of Relative Cytokine Expression at Operative Knee
Quadratic discriminant analysis (QDA) was conducted to evaluate the combined capacity of cytokine responses to predict the state of tissue in response to chronic joint infection. The ANOVA data showed elevated cytokine profiles in both Implant Only and Inf+Implant, so QDA was conducted at the operative knee location to separate these groups. QDA allows an analysis of total cytokine profiles, rather than considering each cytokine in isolation. Using SAS JMP, all measured responses were cast as covariates, and the “group” was assigned as a classification category (Implant Only, Inf+Implant). The Shrink Covariances option was applied to optimize the QDA model for differences in covariances between groups. This analysis included 11 covariates: IL-1α, IL-1β, IL-4, IL-5, IL-6, IL-10, IL-12p70, IL-13, GM-CSF, IFN-γ, and TNF-α. Biplot rays are plotted to indicate the degree to which each covariate influences the model, with the direction and magnitude signifying the degree of association with the respective group. Heat maps of relative cytokine concentrations are shown along with the QDA analysis to illustrate differences in groups for each cytokine. To construct heat maps, cytokine concentrations (ng/g) were normalized between 0 (lowest value) and 1 (highest value) for each cytokine individually to show the relative increases of each cytokine between the three groups. Green coloring indicates a low relative concentration, and red indicates a high relative concentration. The stronger the intensity of color, the more polarized the value.
3. Results
Changes in tissue-level cytokine concentrations were observed between Sham, Implant Only, and Inf+Implant groups in implant-related and infection-specific manners. Overall, cytokine concentrations were higher for Implant Only and Inf+Implant groups compared to Sham. Intra-group differences between locations were also investigated. Tissues at the operative knee (i.e., the site of debridement) were compared to all other locations. Cytokine profiles were compared between these locations to look for spatially-dependent differences relevant for debridement. The operative knee and operative leg distal locations generally produced higher cytokine concentrations than the contralateral knee and operative leg proximal locations. The specific results are discussed over the following sections and can be seen in Figures 2–4.
Figure 2.

IL-1α, IL-5, IL-10, IL-12p70, IL-13, GM-CSF, IFN-γ, and TNF-α concentrations in response to implant and infection. Concentrations are expressed as nanogram of cytokine per gram of tissue (ng/g). Statistically significant differences (p<0.05) in protein concentration between Sham (N=6), Implant Only (N=6), and Inf+Implant (N=6) groups are marked for each location: “S” represents different than Sham group; “C” denotes different than Implant Only group; “I” denotes different than Inf+Implant group. All locations were compared to the operative knee site within each group, and statistically significant differences between locations are marked with striped bars to indicate difference in concentration compared to the operative knee at p<0.05.
Figure 4.
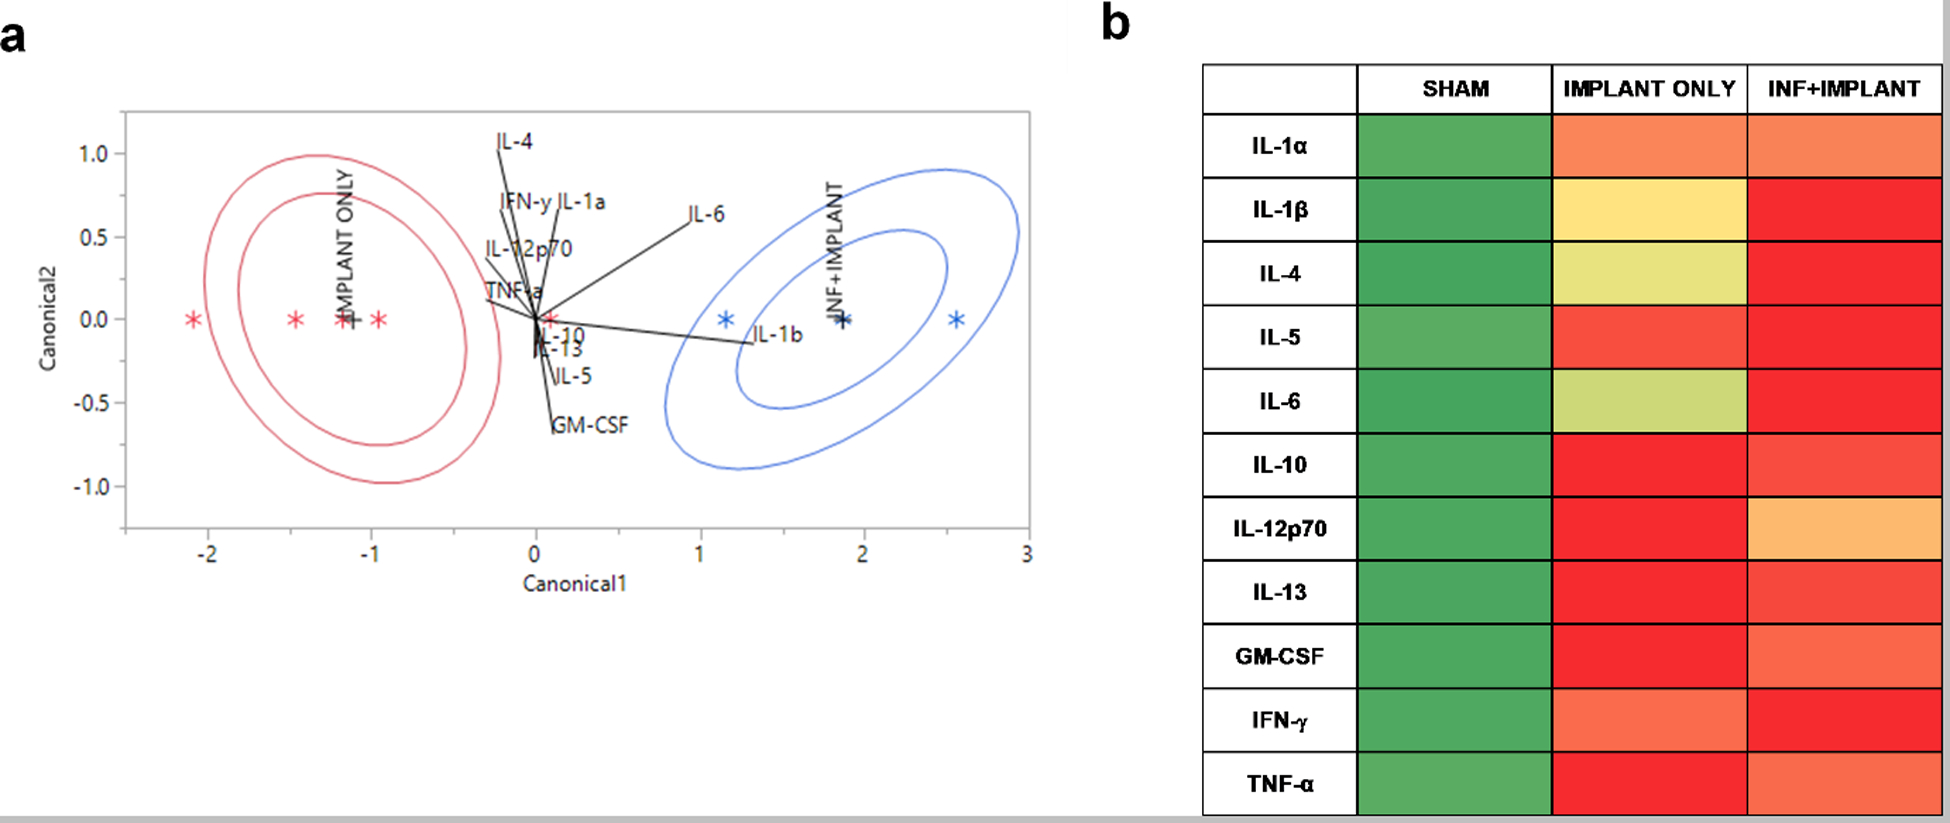
QDA analysis (a) and heat map of relative cytokine concentrations (b). QDA analysis (a) shows the influence of the eleven cytokines on classification into Implant Only (red) or Inf+Implant (blue) groups. Biplot rays illustrate the degree of association with each group, and ellipses are drawn to show the mean ± 95% CI for the cumulative cytokine profiles. Heat maps of relative cytokine concentrations (b) illustrate the relative increases in concentration between the three groups for direct comparison between cytokines. For heat maps, cytokine concentrations (ng/g) were normalized between 0 and 1 for each cytokine to show relative increases. Green represents a low relative concentration, and red represents a high relative concentration.
3.1. Eight Cytokines Elevated in Implant-Related Manner
Of the eleven cytokines, eight produced increases in both Implant Only and Inf+Implant groups compared to Sham (Figure 2): IL-1α, IL-5, IL-10, IL-12p70, IL-13, GM-CSF, IFN-γ, and TNF-α. These cytokines showed elevated concentrations at the operative knee and operative distal locations compared to Sham (p<0.05), but there were generally no significant differences between Implant Only and Inf+Implant groups (exceptions: IL-5 and IL-10 at the operative distal location). The profiles for Implant Only and Inf+Implant groups across different locations were similar for all eight of these cytokines. Group-dependent differences at p<0.05 are marked with letters S (significantly different than Sham group), C (significantly different than Implant Only group), and I (significantly different than Inf+Implant group). Additionally, all tissue locations were compared to the operative knee site to understand spatial differences, and significant differences at p<0.05 between locations are marked with striped bars. The average values ± SEM can be found in Supplementary Table S1.
3.2. Three Cytokines Showed Infection-Specific Increase
For three of the eleven cytokines, there was an increase in the Implant Only group, and a further increase in concentration was observed for the Inf+Implant group. IL-1β, IL-4, and IL-6 showed an infection-specific trend, with the highest concentrations at the operative knee location (Fig. 3). The contralateral knee and operative leg proximal locations were not significantly different between Sham, Implant Only, and Inf+Implant groups (p>0.05). Group-dependent differences at p<0.05 are marked with letters S (significantly different than Sham group), C (significantly different than Implant Only group), and I (significantly different than Inf+Implant group) in Figure 3. Additionally, all tissue locations were compared to the operative knee site, and significant differences at p<0.05 between locations are marked with striped bars. The average values ± SEM can be found in Supplementary Table S1.
Figure 3.

IL-1β, IL-4, and IL-6 tissue concentrations in response to implant and infection. Concentrations are expressed as nanogram of cytokine per gram of tissue (ng/g). Statistically significant differences (p<0.05) in protein concentration between Sham (N=6), Implant Only (N=6), and Inf+Implant (N=6) groups are marked for each location: “S” represents different than Sham group; “C” denotes different than Implant Only group; “I” denotes different than Inf+Implant group. All locations were compared to the operative knee site within each group, and statistically significant differences between locations are marked with striped bars to indicate the concentration at that location is different than the operative knee at p<0.05. All labeling is consistent with Figure 2.
3.3. Quadratic Discriminant Analysis (QDA) Analysis and Heat Maps of Cytokine Profiles at the Operative Knee
Total cytokine profiles were analyzed via QDA with SAS JMP on all measured cytokine responses at the operative knee location to compare Implant Only and Inf+Implant groups. The ANOVA data indicated that cytokine profiles were elevated in both of these groups, and QDA focused on the disparate profiles between Implant Only and Inf+Implant to identify cytokines most specific for infection on a tissue level. This analysis classified the combined concentrations of all cytokines observed into pre-determined groups (Implant Only, Inf+Implant) by plotting canonical scores calculated by the quadratic model. The 95% confidence intervals (CIs) are shown for each group, with Implant Only in red and Inf+Implant in blue. Biplot rays are shown to denote the degree of association of each cytokine with each group. There were no misclassifications in the model. Heat maps were constructed to show relative cytokine concentrations and compare the influence of cytokines on the cumulative cytokine profile for each group. Cytokine concentrations in ng/g were normalized between 0 (lowest value) and 1 (highest value) for each cytokine. Green represents a low relative cytokine concentration, and red represents a high relative cytokine concentration; the intensity of color denotes the degree of polarization. Relative levels in the Sham group were in the lowest 10th percentile for all cytokines, which can be observed by the intense green color. Colors in the Implant Only and Inf+Implant ranged from the 43rd percentile (mild green-yellow) to 100th percentile (bright red). The heat map results complement the findings of the QDA by illustrating the contrast in relative concentrations between Implant Only and Inf+Implant groups for IL-1β, IL-4, IL-6, and IL-12p70.
4. Discussion
Implant-associated infections are devastating post-surgical complications and are the leading cause of implant failure in TKA procedures.1 Diagnosis and treatment impose a significant burden for the health care system as well as individual patients, and the annual cost of infected revisions is projected to exceed $1.5 billion by the end of 2020.41 Cytokine measurements in synovial fluid and serum of patients suffering from chronic implant-related infections have illustrated high sensitivity and specificity of these targets for diagnostic purposes.20 However, the primary method for treatment of chronic, recurrent implant-associated infections is debridement, which has highly subjective endpoints.21 Treatment has not progressed to more objective metrics, presenting a challenge for clinicians who are tasked with precise, complete removal of infected tissues. Cytokine biomarkers currently used for diagnostics may provide potential for use as quantitative markers for establishing intra-operative debridement margins between healthy and non-healthy tissue. In this study, eleven cytokines were analyzed in a rodent model of chronic implant-associated infection to identify biomarkers that have the potential to delineate infected vs. non-infected tissues. Ultimately, these cytokines could aid clinicians in establishing debridement margins using reliable, quantitative metrics.
Eight cytokines exhibited implant-related increases in concentration at the operative knee: IL-1α, IL-5, IL-10, IL-12p70, IL-13, GM-CSF, IFN-γ, and TNF-α (Fig. 2). For these cytokines, Implant Only and Inf+Implant groups showed higher concentrations than the Sham group (p<0.05), but there were no significant differences between Implant Only and Inf+Implant groups directly at the operative knee. These cytokines have previously been linked to inflammation associated with prosthetics,42 and our results indicated that inflammation at the joint can be attributed to the presence of a K-wire implant (Fig. 2). All of these cytokines gave the highest response directly at the operative knee location, with the exception of IL-1α for the Inf+Implant group, which had an unclear trend. Decreased cytokine profiles would suggest a return to healthy tissue,29 which is relevant to debridement, so all tissue locations were compared to the operative knee to investigate the spatially-disparate responses. IL-1α, IFN-γ, and TNF-α did not show the ability to reliably discriminate tissues across locations, and previous studies have noted low specificity in serum for these cytokines in implant-associated infections.43 The ANOVA data in this study suggested they would not be reliable debridement markers (Fig. 2). Disparities between operative knee and operative distal sites for the Inf+Implant group were observed for IL-5, IL-10, IL-13, and IL-12p70, but these differences were not present in the Implant Only group. The Implant Only group still maintained elevated IL-5, IL-10, and IL-13 concentrations at the operative distal site (Fig. 2; p<0.05), but the Inf+Implant group showed a decrease at this location. These are three anti-inflammatory cytokines,44 and they all showed elevation at tissues downstream of the joint in the Implant Only group. IL-12p70 also appeared to follow this trend, but not at a statistically significant level (Fig. 2; p>0.05). IL-12p70 is an immunoregulatory cytokine with both pro- and anti-inflammatory functions and plays a role in cell proliferation during wound healing.45 The exact mechanisms of cytokine dysregulation due to implant and infection are unknown, but the spatially disparate downstream effects observed for these cytokines could be due to a variety of factors, including vascular supply,46 atrophy,35 or differences in wound healing stages.47 While outside the scope of this manuscript, the spatially disparate profiles of these cytokines due to foreign body implant warrant future investigation. GM-CSF was the only implant-related cytokine to show the expected spatially-dependent trend for both the Implant Only and Inf+Implant groups (Fig. 2; p<0.05). GM-CSF has been noted for its role in inflammatory autoimmune diseases and has shown increased concentrations in response to pro-inflammatory stimuli.48 However, the QDA illustrated it was not a good differentiator of inflammation due to implants vs. inflammation due to infection (Fig. 4). Overall, the data in this study indicated that none of the implant-related cytokines were good indicators of debridement margins at the operative knee.
Infection-specific trends in cytokine responses were present for IL-1β, IL-4, and IL-6 in this study (p<0.05). These cytokines have been noted for their roles in infection, demonstrating increases in serum concentrations in response to joint infection.49–51 In this study, these cytokines showed the highest increase in response directly at the operative knee (Fig. 3), highlighting the importance of tissue-level disparities in response to infection. IL-1β and IL-6, two pro-inflammatory cytokines, have demonstrated diagnostic utility and were elevated in response to infection in this study.52 Infection with S. aureus is known to trigger IL-1β release and is concomitant with cell death.53 IL-6 is synthesized in infectious lesions to send out a warning signal of tissue damage, which is then recognized by pathogen-recognition receptors (PRRs), and it is an early initiator of infection-related inflammation.54 Both IL-1β and IL-6 produce signals during infection that ultimately trigger cell death pathways.55 For IL-1β, all locations were significantly different than the operative knee (p<0.05) for both Implant Only and Inf+Implant groups (Fig. 3). IL-6 only reflected this trend in the Inf+Implant group, but the increased concentrations at the operative knee location compared to Implant Only suggested it is still a good indicator of infection presence (p<0.05, Fig.3). IL-4, an anti-inflammatory cytokine, activates the Stat6 pathway in infection and suppresses cell-mediated death.56 IL-4 trends were similar to IL-6, and only the Inf+Implant group showed a significant decrease in concentration at the operative distal location (p<0.05). QDA and heat maps were constructed to comparatively assess the contributions of these cytokines to each of the groups. The heat maps showed relative concentrations of cytokines and suggested IL-1β, IL-4, and IL-6 may all serve as good indicators of infected tissues at the joint. Further analysis of QDA data indicated IL-1β and IL-6 are strongly indicative of Inf+Implant tissues (Fig. 4), while IL-4 plays a role in both Implant Only and Inf+Implant groups when considering total cytokine contributions. The QDA demonstrated that IL-1β and IL-6 show a stronger relationship to Inf+Implant tissues and may serve as better indicators for debridement.
There were several limitations to this study. The cytokine concentrations were measured in rodents that were treated with anesthetics and analgesics. Many studies have observed suppression of cytokine production following administration of these agents.57, 58 The use of isoflurane and buprenorphine was specifically chosen to avoid significant modulation of cytokine response.37 Buprenorphine has been shown to have no significant effect on cytokine production in rodents.59 While isoflurane has been shown to increase levels of pro-inflammatory cytokines like IL-1β, IL-6, and TNF-α,60 comparison with the Sham group still illustrated an increase in levels of these cytokines due to both implants and infection. Many approaches to studying implant-associated infection have been pursued in literature,61 and this study represents only one infecting organism, S. aureus, at one post-surgical time point in a non-load bearing K-wire implant model. Future studies will focus on varying durations of infection, include other infecting organisms, and multiple inoculation doses.
The results of this study demonstrated that tissue-level concentrations of IL-1β and IL-6 are strongly indicative of infected tissues through ANOVA comparisons as well as QDA classifications. These cytokines have previously been validated for diagnostics of implant-associated infections in serum, and they have established roles in infection response. The findings presented here offer an opportunity to expand their utility beyond diagnostics as tissue-level indicators of infection. These results provided evidence that these cytokines are worth pursuing in the development of objective biomarkers to guide debridement and treatment of chronic implant-associated infections. Ultimately, this study laid the foundation to develop quantitative, tissue-level biomarkers to aid surgical decision making. In the future, these cytokines could be investigated for their ability to guide intra-operative debridement in chronic implant-associated infections.
Supplementary Material
Acknowledgements
Funding for this work was provided by NIH K Award 1K08AR073921. The authors would like to thank Suzanne Danley for her editorial suggestions.
References
- 1.Tande AJ; Patel R, Prosthetic joint infection. Clin Microbiol Rev 2014, 27 (2), 302–45. [DOI] [PMC free article] [PubMed] [Google Scholar]
- 2.Seebach E; Kubatzky KF, Chronic Implant-Related Bone Infections-Can Immune Modulation be a Therapeutic Strategy? Front Immunol 2019, 10, 1724. [DOI] [PMC free article] [PubMed] [Google Scholar]
- 3.Ma CY; Lu YD; Bell KL; Wang JW; Ko JY; Wang CJ; Kuo FC, Predictors of Treatment Failure After 2-Stage Reimplantation for Infected Total Knee Arthroplasty: A 2- to 10-Year Follow-Up. J Arthroplasty 2018, 33 (7), 2234–2239. [DOI] [PubMed] [Google Scholar]
- 4.Aali Rezaie A; Goswami K; Shohat N; Tokarski AT; White AE; Parvizi J, Time to Reimplantation: Waiting Longer Confers No Added Benefit. J Arthroplasty 2018, 33 (6), 1850–1854. [DOI] [PubMed] [Google Scholar]
- 5.Kandel CE; Jenkinson R; Daneman N; Backstein D; Hansen BE; Muller MP; Katz KC; Widdifield J; Bogoch E; Ward S; Sajja A; Jeldes FG; McGeer A, Predictors of Treatment Failure for Hip and Knee Prosthetic Joint Infections in the Setting of 1- and 2-Stage Exchange Arthroplasty: A Multicenter Retrospective Cohort. Open Forum Infect Dis 2019, 6 (11), ofz452. [DOI] [PMC free article] [PubMed] [Google Scholar]
- 6.Ma L; Zhang H; Yin YL; Guo WZ; Ma YQ; Wang YB; Shu C; Dong LQ, Role of interleukin-6 to differentiate sepsis from non-infectious systemic inflammatory response syndrome. Cytokine 2016, 88, 126–135. [DOI] [PubMed] [Google Scholar]
- 7.Punyadeera C; Schneider EM; Schaffer D; Hsu HY; Joos TO; Kriebel F; Weiss M; Verhaegh WF, A biomarker panel to discriminate between systemic inflammatory response syndrome and sepsis and sepsis severity. J Emerg Trauma Shock 2010, 3 (1), 26–35. [DOI] [PMC free article] [PubMed] [Google Scholar]
- 8.Deirmengian C; Hallab N; Tarabishy A; Della Valle C; Jacobs JJ; Lonner J; Booth RE, Synovial fluid biomarkers for periprosthetic infection. Clin Orthop Relat Res 2010, 468 (8), 2017–23. [DOI] [PMC free article] [PubMed] [Google Scholar]
- 9.Shahi A; Kheir MM; Tarabichi M; Hosseinzadeh HRS; Tan TL; Parvizi J, Serum D-Dimer Test Is Promising for the Diagnosis of Periprosthetic Joint Infection and Timing of Reimplantation. J Bone Joint Surg Am 2017, 99 (17), 1419–1427. [DOI] [PubMed] [Google Scholar]
- 10.Signore A; Sconfienza LM; Borens O; Glaudemans AWJM; Cassar-Pullicino V; Trampuz A; Winkler H; Gheysens O; Vanhoenacker FMHM; Petrosillo N; Jutte PC, Consensus document for the diagnosis of prosthetic joint infections: a joint paper by the EANM, EBJIS, and ESR (with ESCMID endorsement). Eur J Nucl Med Mol Imaging 2019, 46 (4), 971–988. [DOI] [PMC free article] [PubMed] [Google Scholar]
- 11.Gomes LSM, Early Diagnosis of Periprosthetic Joint Infection of the Hip-Current Status, Advances, and Perspectives. Rev Bras Ortop (Sao Paulo) 2019, 54 (4), 368–376. [DOI] [PMC free article] [PubMed] [Google Scholar]
- 12.Alijanipour P; Bakhshi H; Parvizi J, Diagnosis of periprosthetic joint infection: the threshold for serological markers. Clin Orthop Relat Res 2013, 471 (10), 3186–95. [DOI] [PMC free article] [PubMed] [Google Scholar]
- 13.Li C; Renz N; Trampuz A, Management of Periprosthetic Joint Infection. Hip Pelvis 2018, 30 (3), 138–146. [DOI] [PMC free article] [PubMed] [Google Scholar]
- 14.Schulte W; Bernhagen J; Bucala R, Cytokines in sepsis: potent immunoregulators and potential therapeutic targets--an updated view. Mediators Inflamm 2013, 2013, 165974. [DOI] [PMC free article] [PubMed] [Google Scholar]
- 15.Dinarello CA, Historical insights into cytokines. Eur J Immunol 2007, 37Suppl 1, S34–45. [DOI] [PMC free article] [PubMed] [Google Scholar]
- 16.Turner MD; Nedjai B; Hurst T; Pennington DJ, Cytokines and chemokines: At the crossroads of cell signalling and inflammatory disease. Biochim Biophys Acta 2014, 1843 (11), 2563–2582. [DOI] [PubMed] [Google Scholar]
- 17.Nilsdotter-Augustinsson A; Briheim G; Herder A; Ljunghusen O; Wahlström O; Ohman L, Inflammatory response in 85 patients with loosened hip prostheses: a prospective study comparing inflammatory markers in patients with aseptic and septic prosthetic loosening. Acta Orthop 2007, 78 (5), 629–39. [DOI] [PubMed] [Google Scholar]
- 18.Frangiamore SJ; Siqueira MB; Saleh A; Daly T; Higuera CA; Barsoum WK, Synovial Cytokines and the MSIS Criteria Are Not Useful for Determining Infection Resolution After Periprosthetic Joint Infection Explantation. Clin Orthop Relat Res 2016, 474 (7), 1630–9. [DOI] [PMC free article] [PubMed] [Google Scholar]
- 19.Gollwitzer H; Dombrowski Y; Prodinger PM; Peric M; Summer B; Hapfelmeier A; Saldamli B; Pankow F; von Eisenhart-Rothe R; Imhoff AB; Schauber J; Thomas P; Burgkart R; Banke IJ, Antimicrobial peptides and proinflammatory cytokines in periprosthetic joint infection. J Bone Joint Surg Am 2013, 95 (7), 644–51. [DOI] [PubMed] [Google Scholar]
- 20.Monastero RN; Pentyala S, Cytokines as Biomarkers and Their Respective Clinical Cutoff Levels. Int J Inflam 2017, 2017, 4309485. [DOI] [PMC free article] [PubMed] [Google Scholar]
- 21.Sousa R; Abreu MA, Treatment of Prosthetic Joint Infection with Debridement, Antibiotics and Irrigation with Implant Retention - a Narrative Review. J Bone Jt Infect 2018, 3 (3), 108–117. [DOI] [PMC free article] [PubMed] [Google Scholar]
- 22.Shahi A; Tan TL; Kheir MM; Tan DD; Parvizi J, Diagnosing Periprosthetic Joint Infection: And the Winner Is? J Arthroplasty 2017, 32 (9S), S232–S235. [DOI] [PubMed] [Google Scholar]
- 23.del Pozo JL; Patel R, The challenge of treating biofilm-associated bacterial infections. Clin Pharmacol Ther 2007, 82 (2), 204–9. [DOI] [PubMed] [Google Scholar]
- 24.Li C; Renz N; Trampuz A; Ojeda-Thies C, Twenty common errors in the diagnosis and treatment of periprosthetic joint infection. Int Orthop 2020, 44 (1), 3–14. [DOI] [PMC free article] [PubMed] [Google Scholar]
- 25.Qu X; Zhai Z; Li H; Liu X; Zhu Z; Wang Y; Liu G; Dai K, PCR-based diagnosis of prosthetic joint infection. J Clin Microbiol 2013, 51 (8), 2742–6. [DOI] [PMC free article] [PubMed] [Google Scholar]
- 26.Cannon JG; Tompkins RG; Gelfand JA; Michie HR; Stanford GG; van der Meer JW; Endres S; Lonnemann G; Corsetti J; Chernow B, Circulating interleukin-1 and tumor necrosis factor in septic shock and experimental endotoxin fever. J Infect Dis 1990, 161 (1), 79–84. [DOI] [PubMed] [Google Scholar]
- 27.Werner S; Grose R, Regulation of wound healing by growth factors and cytokines. Physiol Rev 2003, 83 (3), 835–70. [DOI] [PubMed] [Google Scholar]
- 28.Teijaro JR, Cytokine storms in infectious diseases. Semin Immunopathol 2017, 39 (5), 501–503. [DOI] [PMC free article] [PubMed] [Google Scholar]
- 29.Soetens JFJ; Worsley PR; Bader DL; Oomens CWJ, Investigating the influence of intermittent and continuous mechanical loading on skin through non-invasive sampling of IL-1α. J Tissue Viability 2019, 28 (1), 1–6. [DOI] [PubMed] [Google Scholar]
- 30.Currie HN; Loos MS; Vrana JA; Dragan K; Boyd JW, Spatial cytokine distribution following traumatic injury. Cytokine 2014, 66 (2), 112–8. [DOI] [PubMed] [Google Scholar]
- 31.Adams CS; Antoci V; Harrison G; Patal P; Freeman TA; Shapiro IM; Parvizi J; Hickok NJ; Radin S; Ducheyne P, Controlled release of vancomycin from thin sol-gel films on implant surfaces successfully controls osteomyelitis. J Orthop Res 2009, 27 (6), 701–9. [DOI] [PubMed] [Google Scholar]
- 32.Peng KT; Hsieh CC; Huang TY; Chen PC; Shih HN; Lee MS; Chang PJ, Staphylococcus aureus biofilm elicits the expansion, activation and polarization of myeloid-derived suppressor cells in vivo and in vitro. PLoS One 2017, 12 (8), e0183271. [DOI] [PMC free article] [PubMed] [Google Scholar]
- 33.Lucke M; Schmidmaier G; Sadoni S; Wildemann B; Schiller R; Stemberger A; Haas NP; Raschke M, A new model of implant-related osteomyelitis in rats. J Biomed Mater Res B Appl Biomater 2003, 67 (1), 593–602. [DOI] [PubMed] [Google Scholar]
- 34.Penn-Barwell JG; Rand BC; Brown KV; Wenke JC, A versatile model of open-fracture infection : a contaminated segmental rat femur defect. Bone Joint Res 2014, 3 (6), 187–92. [DOI] [PMC free article] [PubMed] [Google Scholar]
- 35.Morris JL; Letson HL; Grant A; Wilkinson M; Hazratwala K; McEwen P, Experimental model of peri-prosthetic infection of the knee caused by. Biol Open 2019, 8 (9). [DOI] [PMC free article] [PubMed] [Google Scholar]
- 36.Fan Y; Xiao Y; Sabuhi WA; Leape CP; Gil D; Grindy S; Muratoglu OK; Bedair H; Collins JE; Randolph M; Oral E, Longitudinal Model of Periprosthetic Joint Infection in the Rat. J Orthop Res 2020, 38 (5), 1101–1112. [DOI] [PubMed] [Google Scholar]
- 37.Al-Mousawi AM; Kulp GA; Branski LK; Kraft R; Mecott GA; Williams FN; Herndon DN; Jeschke MG, Impact of anesthesia, analgesia, and euthanasia technique on the inflammatory cytokine profile in a rodent model of severe burn injury. Shock 2010, 34 (3), 261–8. [DOI] [PMC free article] [PubMed] [Google Scholar]
- 38.Aktekin CN; Ozturk AM; Tabak AY; Altay M; Korkusuz F, A different perspective for radiological evaluation of experimental osteomyelitis. Skeletal Radiol 2007, 36 (10), 945–50. [DOI] [PubMed] [Google Scholar]
- 39.Askar M; Ashraf W; Scammell B; Bayston R, Comparison of different human tissue processing methods for maximization of bacterial recovery. Eur J Clin Microbiol Infect Dis 2019, 38 (1), 149–155. [DOI] [PMC free article] [PubMed] [Google Scholar]
- 40.Hulse RE; Kunkler PE; Fedynyshyn JP; Kraig RP, Optimization of multiplexed bead-based cytokine immunoassays for rat serum and brain tissue. J Neurosci Methods 2004, 136 (1), 87–98. [DOI] [PMC free article] [PubMed] [Google Scholar]
- 41.Kurtz SM; Lau E; Watson H; Schmier JK; Parvizi J, Economic burden of periprosthetic joint infection in the United States. J Arthroplasty 2012, 27 (8 Suppl), 61–5.e1. [DOI] [PubMed] [Google Scholar]
- 42.Shah K; Mohammed A; Patil S; McFadyen A; Meek RM, Circulating cytokines after hip and knee arthroplasty: a preliminary study. Clin Orthop Relat Res 2009, 467 (4), 946–51. [DOI] [PMC free article] [PubMed] [Google Scholar]
- 43.Fröschen FS; Schell S; Schildberg FA; Klausing A; Kohlhof H; Gravius S; Randau TM, Analysis of synovial biomarkers with a multiplex protein microarray in patients with PJI undergoing revision arthroplasty of the hip or knee joint. Arch Orthop Trauma Surg 2020. [DOI] [PubMed] [Google Scholar]
- 44.Zhang JM; An J, Cytokines, inflammation, and pain. Int Anesthesiol Clin 2007, 45 (2), 27–37. [DOI] [PMC free article] [PubMed] [Google Scholar]
- 45.Li J; Bower AJ; Vainstein V; Gluzman-Poltorak Z; Chaney EJ; Marjanovic M; Basile LA; Boppart SA, Effect of recombinant interleukin-12 on murine skin regeneration and cell dynamics using in vivo multimodal microscopy. Biomed Opt Express 2015, 6 (11), 4277–87. [DOI] [PMC free article] [PubMed] [Google Scholar]
- 46.Sprague AH; Khalil RA, Inflammatory cytokines in vascular dysfunction and vascular disease. Biochem Pharmacol 2009, 78 (6), 539–52. [DOI] [PMC free article] [PubMed] [Google Scholar]
- 47.Han AA; Currie HN; Loos MS; Vrana JA; Fabyanic EB; Prediger MS; Boyd JW, Spatiotemporal phosphoprotein distribution and associated cytokine response of a traumatic injury. Cytokine 2016, 79, 12–22. [DOI] [PMC free article] [PubMed] [Google Scholar]
- 48.Egea L; Hirata Y; Kagnoff MF, GM-CSF: a role in immune and inflammatory reactions in the intestine. Expert Rev Gastroenterol Hepatol 2010, 4 (6), 723–31. [DOI] [PMC free article] [PubMed] [Google Scholar]
- 49.Lee A; Park SP; Park CH; Kang BH; Park SH; Ha SJ; Jung KC, IL-4 Induced Innate CD8+ T Cells Control Persistent Viral Infection. PLoS Pathog 2015, 11 (10), e1005193. [DOI] [PMC free article] [PubMed] [Google Scholar]
- 50.Xie K; Dai K; Qu X; Yan M, Serum and Synovial Fluid Interleukin-6 for the Diagnosis of Periprosthetic Joint Infection. Sci Rep 2017, 7 (1), 1496. [DOI] [PMC free article] [PubMed] [Google Scholar]
- 51.Fillerova R; Gallo J; Radvansky M; Kraiczova V; Kudelka M; Kriegova E, Excellent Diagnostic Characteristics for Ultrafast Gene Profiling of. J Clin Microbiol 2017, 55 (9), 2686–2697. [DOI] [PMC free article] [PubMed] [Google Scholar]
- 52.Deirmengian C; Kardos K; Kilmartin P; Cameron A; Schiller K; Parvizi J, Diagnosing periprosthetic joint infection: has the era of the biomarker arrived? Clin Orthop Relat Res 2014, 472 (11), 3254–62. [DOI] [PMC free article] [PubMed] [Google Scholar]
- 53.Lopez-Castejon G; Brough D, Understanding the mechanism of IL-1β secretion. Cytokine Growth Factor Rev 2011, 22 (4), 189–95. [DOI] [PMC free article] [PubMed] [Google Scholar]
- 54.Tanaka T; Narazaki M; Kishimoto T, IL-6 in inflammation, immunity, and disease. Cold Spring Harb Perspect Biol 2014, 6 (10), a016295. [DOI] [PMC free article] [PubMed] [Google Scholar]
- 55.Bergsbaken T; Fink SL; Cookson BT, Pyroptosis: host cell death and inflammation. Nat Rev Microbiol 2009, 7 (2), 99–109. [DOI] [PMC free article] [PubMed] [Google Scholar]
- 56.Zhang J; Bárdos T; Shao Q; Tschopp J; Mikecz K; Glant TT; Finnegan A, IL-4 potentiates activated T cell apoptosis via an IL-2-dependent mechanism. J Immunol 2003, 170 (7), 3495–503. [DOI] [PubMed] [Google Scholar]
- 57.Hong JY; Lim KT, Effect of preemptive epidural analgesia on cytokine response and postoperative pain in laparoscopic radical hysterectomy for cervical cancer. Reg Anesth Pain Med 2008, 33 (1), 44–51. [DOI] [PubMed] [Google Scholar]
- 58.Kawasaki T; Ogata M; Kawasaki C; Ogata J; Inoue Y; Shigematsu A, Ketamine suppresses proinflammatory cytokine production in human whole blood in vitro. Anesth Analg 1999, 89 (3), 665–9. [DOI] [PubMed] [Google Scholar]
- 59.Peterson NC; Nunamaker EA; Turner PV, To Treat or Not to Treat: The Effects of Pain on Experimental Parameters. Comp Med 2017, 67 (6), 469–482. [PMC free article] [PubMed] [Google Scholar]
- 60.Wu X; Lu Y; Dong Y; Zhang G; Zhang Y; Xu Z; Culley DJ; Crosby G; Marcantonio ER; Tanzi RE; Xie Z, The inhalation anesthetic isoflurane increases levels of proinflammatory TNF-α, IL-6, and IL-1β. Neurobiol Aging 2012, 33 (7), 1364–78. [DOI] [PMC free article] [PubMed] [Google Scholar]
- 61.Carli AV; Ross FP; Bhimani SJ; Nodzo SR; Bostrom MP, Developing a Clinically Representative Model of Periprosthetic Joint Infection. J Bone Joint Surg Am 2016, 98 (19), 1666–1676. [DOI] [PubMed] [Google Scholar]
Associated Data
This section collects any data citations, data availability statements, or supplementary materials included in this article.