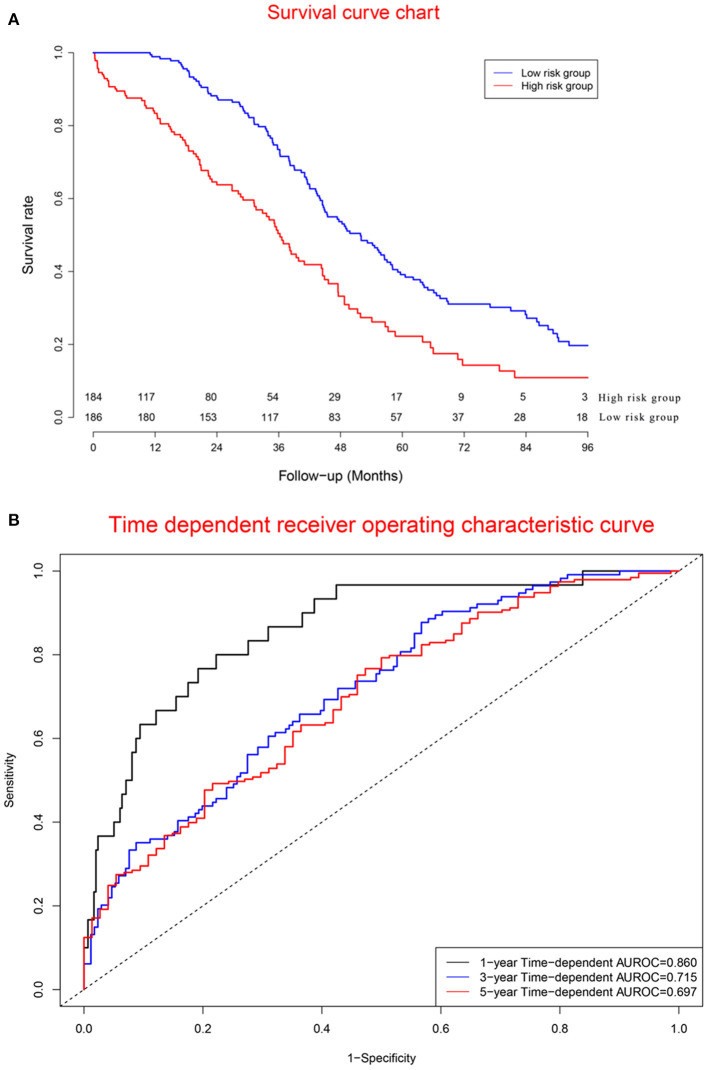
Figure 7.
Clinical performance in validation cohort: (A). Survival curves for high risk group and low risk group; (B). Time-dependent receiver operating characteristic curves. The mortality rate in the high risk group was significantly higher than that in the low risk group. Concordance indexes were 0.860, 0.715, and 0.679 for 1-, 3-, and 5-year survival, respectively (B), indicating that the prognostic model has a good predictive value for the prognosis of ovarian cancer patients.

