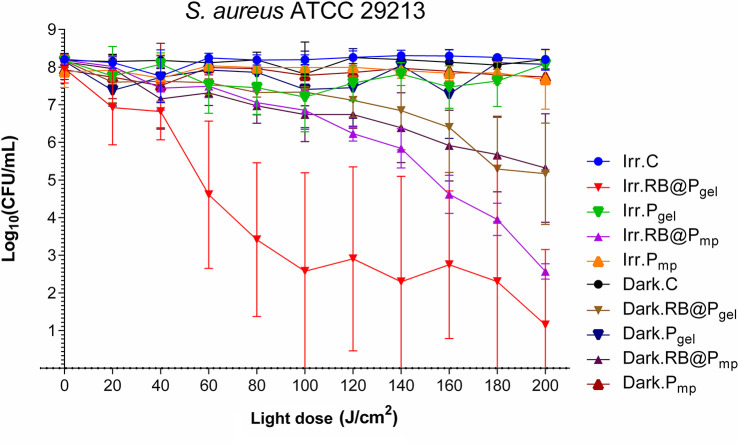
Figure 2.
Survival curves corresponding to the photodynamic inactivation of Staphylococcus aureus. Every point is the average of three independent experiments. Error bars correspond to the standard deviations. Legend titles: Irr, irradiated samples; Dark, controls in the darkness; C, control, only microbial suspension; RB@Pgel, Amberlite® IRA-400 (Pgel) loaded with Rose Bengal (RB); Pgel, Pgel resin without RB; RB@Pmp, Amberlite® IRA-900 (Pmp) loaded with RB; Pmp, Pmp resin without RB.

