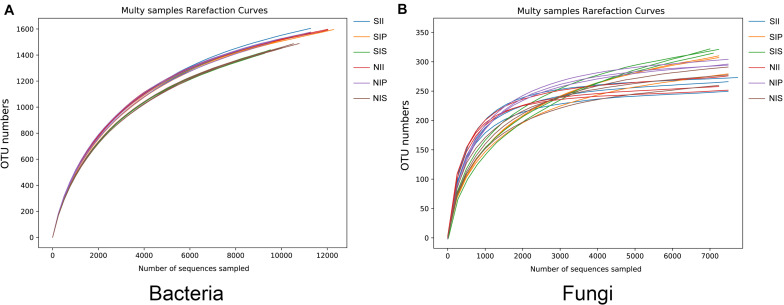
FIGURE 1.
Rarefaction curves of the peanut rhizosphere (IP), sorghum rhizosphere (IS), and interspecific interaction zone (II) microbial communities under different soil conditions (S, 0.25% salt-treated soil condition; N, normal soil condition). (A) Rarefaction curves of bacterial community. (B) Rarefaction curves of fungal community.

