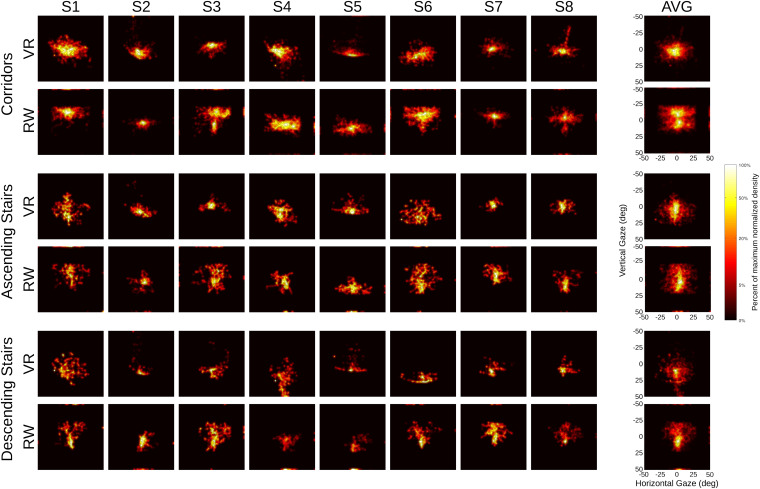
FIGURE 7.
Heat maps of gaze distribution, separated by world (virtual reality vs. real world) and sector type. Data normalized for each participant (S1 … S8) and displayed with a logarithmic scale (with a slight regularization to accommodate zero values), see color bar. Average data across participants in column (AVG). Outer margin in each panel represents data points outside of the specified tracking area, squares span ±50° in each dimension.

