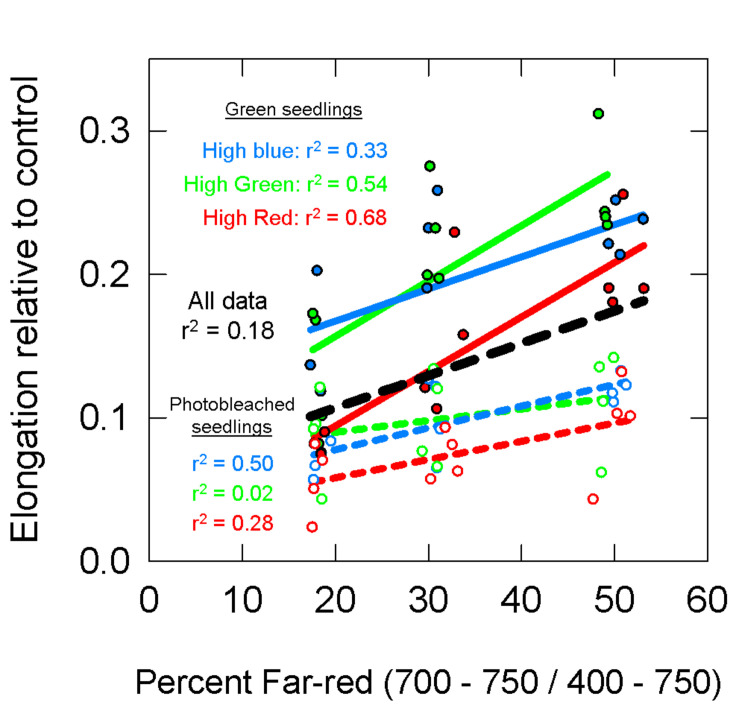
FIGURE 10.
Elongation of green (closed circles, solid lines) and photobleached (open circles, dashed lines) seedlings over a 48 h period relative to dark controls. See Figure 5 for an explanation of colors. Data show that photobleached seedlings elongated less then green seedlings.

