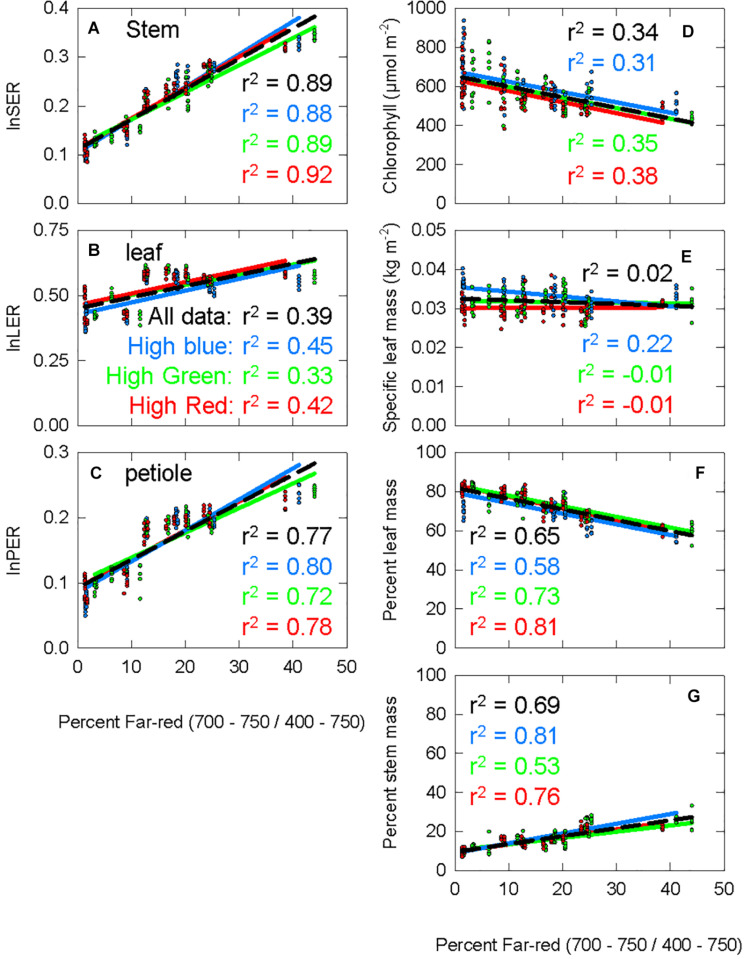
FIGURE 5.
The response of seven physiological parameters to increasing percent far-red. The blue data and lines come from the chamber with spectral background containing a high portion of blue photons (high blue), the green data comes from the high green chamber, and the red data comes from the high red chamber. The r2 value for each background is shown with the respective color. The black dashed line is a trend line running through all the data from all three background light sources, with the corresponding r2 shown in black. (A) The stem extension rate constant (the natural log of the stem extension rate, log of the stem extension rate (lnSER); described in Eqs 4, 5). (B) The leaf expansion rate constant, calculated following the same method as lnSER, but using leaf area at harvest instead of stem length. (C) Petiole extension rate constant, calculated following the same method as lnSER, but using petiole length at harvest instead of stem length. (D) Chlorophyll concentration at harvest. (E) Specific leaf mass, leaf mass divided by leaf area. (F) Percent leaf mass, leaf mass divided by total shoot mass (G) percent stem mass, stem mass divided by total shoot mass.

