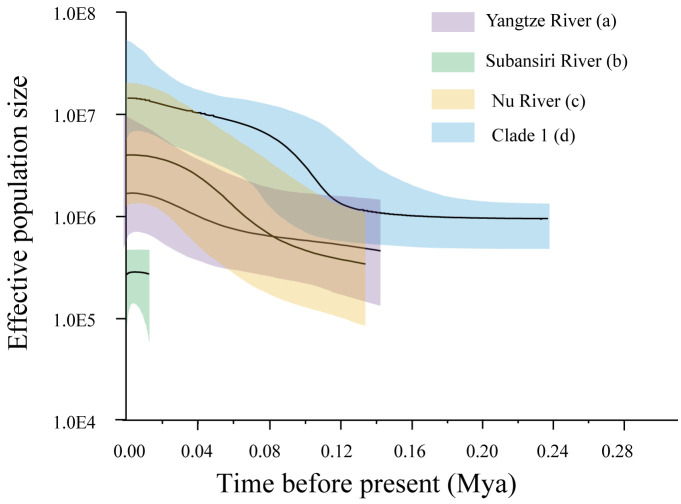
Fig. 5.
Bayesian Skyline Plot (BSP) of the Tibetan stone loaches, T. stenura based on mtDNA (COI, Cyt b). The maximum time is set to the upper 95% HPD of the root height. The median estimate (solid line) and 95% HPD limits (Color area) are indicated. (a) Yangtze River populations (clade 4); (b) Subansiri River population (clade 3); (c) Nu River populations (clade 2); (d) the southwestern and central QTP populations (clade 1).

