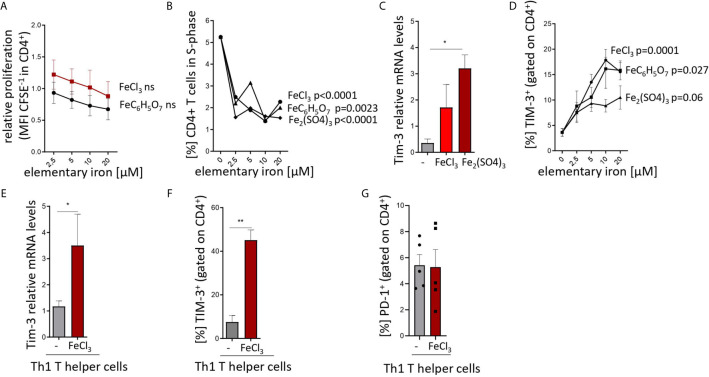
Figure 1.
Iron inhibits T helper cell priming and expansion and stimulates TIM-3 expression in pan-CD4+ T cells and Th1 lymphocytes. (A, B) Splenocytes from C57Bl/6 male mice were stimulated with plate-bound anti-CD3 antibodies and FeCl3, FeC6H5O7, Fe2(SO4)3 were added at different concentrations. Proliferation of CD4+ T cells was measured as CFSE dilution (A) and BrdU incorporation (B) 72 h after culture start by flow cytometry. (C, D) Isolated CD4+ T cells were stimulated with plate-bound anti-CD3 and soluble anti-CD28 and 5 µM (C) or indicated concentrations (D) of FeCl3, FeC6H5O7, or Fe2(SO4)3. Tim3 transcript levels were determined by quantitative real-time PCR and normalized to Hprt mRNA levels using the ΔΔCT method (C). Percentage of TIM3-positive cells was measured by flow cytometry (D). (E–G) Splenic naive CD4+ lymphocytes were differentiated to Th1 cells by stimulation with plate bound anti-CD3, soluble anti-CD28, anti-IL-4 antibodies and IL-12 with or without (−) 5 µM FeCl3 for 72 h. Tim3 transcript levels were determined by quantitative real-time PCR and normalized to Hprt mRNA levels using the ΔΔCT method (E). Percentages of TIM-3 (F) and PD-1 (G) positive cells were measured by flow cytometry. Means ± SEM are shown in the plots. Statistical significance was assessed by one-way ANOVA for each iron source (A, B, D) and by two-tailed Student`s t-test (C, E, F, G). Results of T test and ANOVA are presented in the plots. *p < 0.05, **p < 0.01. (A–F) n = 3. (G) n = 5.

