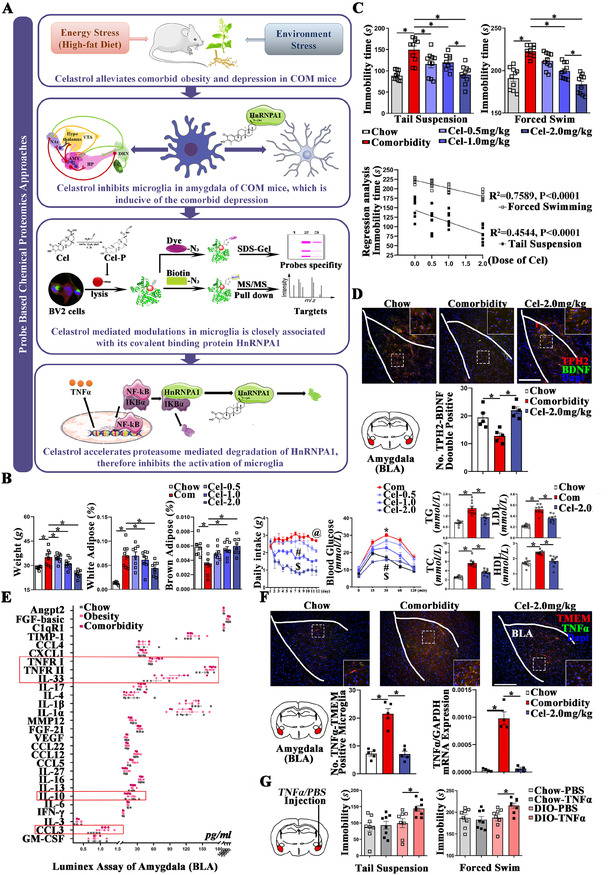
FIGURE 1.

Graphical abstract and identification of amygdala as drug target of celastrol. (A) Graphical abstract. Schematic diagram of animal modeling and probe‐based chemical proteomics approach. (B) Obesity‐related symptoms quantified by weight, daily intake of food, fat rate of white/brown adipose, and quantification of TG/TC/LDL/HDL in serum. @ represents significant difference between Com and Cel‐0.5, # represents significant difference between Cel‐0.5 and Cel‐1.0, and $ represents significant difference between Cel‐1.0 and Cel‐2.0. (C) Depressive behaviors quantified by tail suspension and forced swimming tests, and correlation between dosage of celastrol and the anti‐depression effects. (D) 5‐HTergic neurons stained by TPH2 in BLA. (E) Luminex assay for inflammatory factors in BLA. (F) Quantification of TNF‐α protein by immunofluorescence staining and mRNA by RT‐PCR in BLA, bar 200 μm. (G) Depressive behaviors of mice underwent injection of purified mouse TNF‐α protein or PBS. Results are presented as mean ± SEM. p values are determined by one‐way ANOVA and Tukey's post tests, @,#,$,* p < 0.05.
COM, comorbid obesity and depression; Cel, celastrol; BDNF, brain‐derived neurotrophic factor; TPH2, tryptophan hydroxylase 2; NF‐κB, nuclear factor‐κB; TNF‐α, tumor necrosis factor α; IKBα, NF‐κB inhibitor α; Cel‐P, probe‐labeled celastrol; HnRNPA1(A1), heterogeneous nuclear ribonucleoprotein A1; TG, triglyceride; TC, total cholesterol; LDL, low‐density lipoprotein cholesterol; HDL, high‐density lipoprotein cholesterol; BLA, basolateral amygdala; Chow, chow diet; DIO, diet induced obesity
