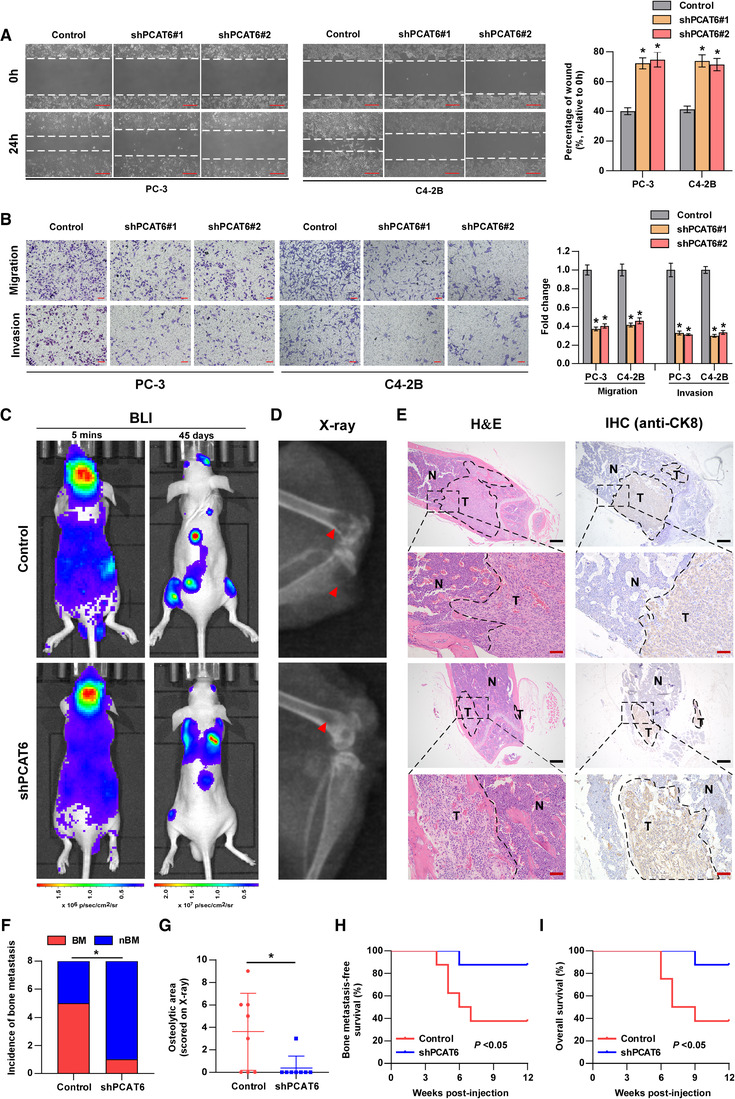
FIGURE 2.

PCAT6 promotes PCa cell migration and invasion in vitro and bone metastasis in vivo. (A) Representative images of wound‐healing assays using PC‐3 and C4‐2B cells, showing cell motility after knockdown of PCAT6 (left panels). Scale bar, 50 μm. Histogram analysis of cell migration distances is shown (right panels). Error bars represent the mean ± SD of triplicate experiments. (B) Representative images of migration and invasion assays using PC‐3 and C4‐2B cells (left panels), showing cell migration and invasion after knockdown of PCAT6. Scale bar, 100 μm. Histogram analysis of migrated or invaded cell counts is shown (right panels). Error bars represent the mean ± SD of triplicate experiments. (C) Representative bioluminescent imaging (BLI) of bone metastasis of a mouse from the indicated group at 5 min and 45 days, respectively. (D) Representative radiographic images of bone metastases in the indicated mice (arrows indicate osteolytic lesions). (E) Representative H&E‐stained sections of posterior limbs from the indicated mouse (left panels). Representative IHC staining of bone lesions and tumor lesions was indicated by CK8 staining (right panels). T, tumor; N, the adjacent nontumor tissues; Scar bar: black, 25 μm; red, 5 μm. (F) Incidence of bone metastasis detected in the indicated group (n = 8/group; male). (G) The sum of bone metastasis scores for each mouse in the indicated group by X‐ray (n = 8/group; male). (H and I) Kaplan–Meier analysis of mouse bone metastasis‐free (H) and overall (I) survival in the indicated groups (n = 8/group; male). All experiments were performed in biological triplicate. Statistical analyses were performed by unpaired Student's t‐test (A, B), χ 2 test (F) , Mann–Whitney U test (G) and the log‐rank test (H, I). * p < 0.05
