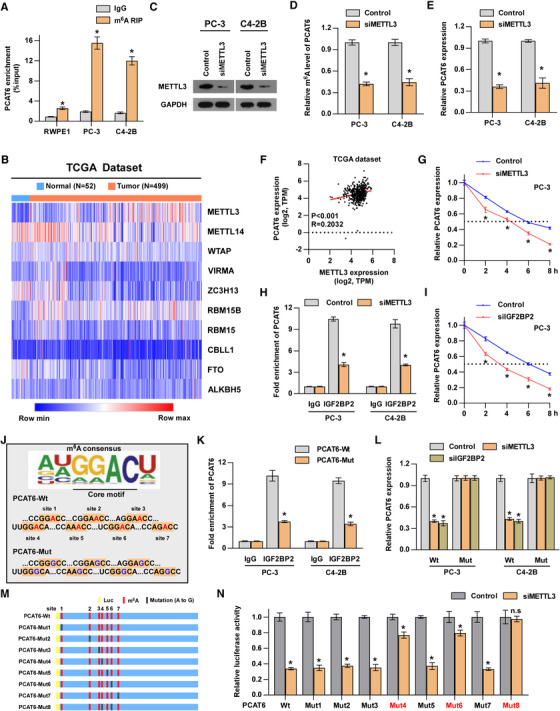
FIGURE 7.

m6A modification contributes to the upregulation of PCAT6 in PCa. (A) m6A RIP‐qPCR analysis of PCAT6 in RWPE‐1, PC‐3, and C4‐2B cells. Error bars represent the mean ± SD of triplicate experiments. (B) Heat map profiling the expression of m6A WERs in the TCGA‐PRAD dataset. (C) Western blotting analysis of METTL3 expression in the indicated cells. GAPDH served as the loading control. (D) m6A RIP‐qPCR analysis of the m6A level in PCAT6 in the indicated cells. Error bars represent the mean ± SD of triplicate experiments. (E) RT‐qPCR analysis of PCAT6 expression in the indicated cells. Error bars represent the mean ± SD of triplicate experiments. (F) Correlation analysis showing the correlation between METTL3 and PCAT6 in the TCGA‐PRAD dataset. (G) Control or METTL3‐knockdown PC‐3 cells were treated with actinomycin D (5 mg/ml) for the indicated periods. Total RNA was purified and then analyzed using RT‐qPCR to examine the mRNA half‐lives of IGF1R. Error bars represent the mean ± SD of triplicate experiments. (H) RIP analysis showing the enrichment of PCAT6 on IGF2BP2 in the indicated cells. Error bars represent the mean ± SD of triplicate experiments. (I) Control or IGF2BP2‐knockdown PC‐3 cells were treated with actinomycin D (5 mg/ml) for the indicated periods. Total RNA was purified and then analyzed using RT‐qPCR to examine the mRNA half‐lives of IGF1R. Error bars represent the mean ± SD of triplicate experiments. (J) The putative wild‐type m6A sites and designed mutant m6A sites in PCAT6. (K) RIP analysis showing the enrichment of PCAT6 on IgG and IGF2BP2 in the PCAT6‐Wt or PCAT6‐Mut PCa cells. Error bars represent the mean ± SD of triplicate experiments. (L) RT‐qPCR analysis of PCAT6 expression in the PCAT6‐Wt or PCAT6‐Mut PCa cells with or without METTL3 or IGF2BP2 knockdown. Transcript levels were normalized to U6 expression. Error bars represent the mean ± SD of triplicate experiments. (M) Schematic representation of mutated (GGAC to GGGC) PCAT6 of pmirGLO vector to investigate the m6A roles on PCAT6 expression. (N) The luciferase activities of different mutated PCAT6 reporter in the indicated groups. Error bars represent the mean ± SD of triplicate experiments. All experiments were performed in biological triplicate. Statistical analyses were performed by unpaired Student's t‐test (A, D, E, G, H, I, K, L, N) and Spearman correlation coefficient (f). * p < 0.05
