
FIGURE 1.
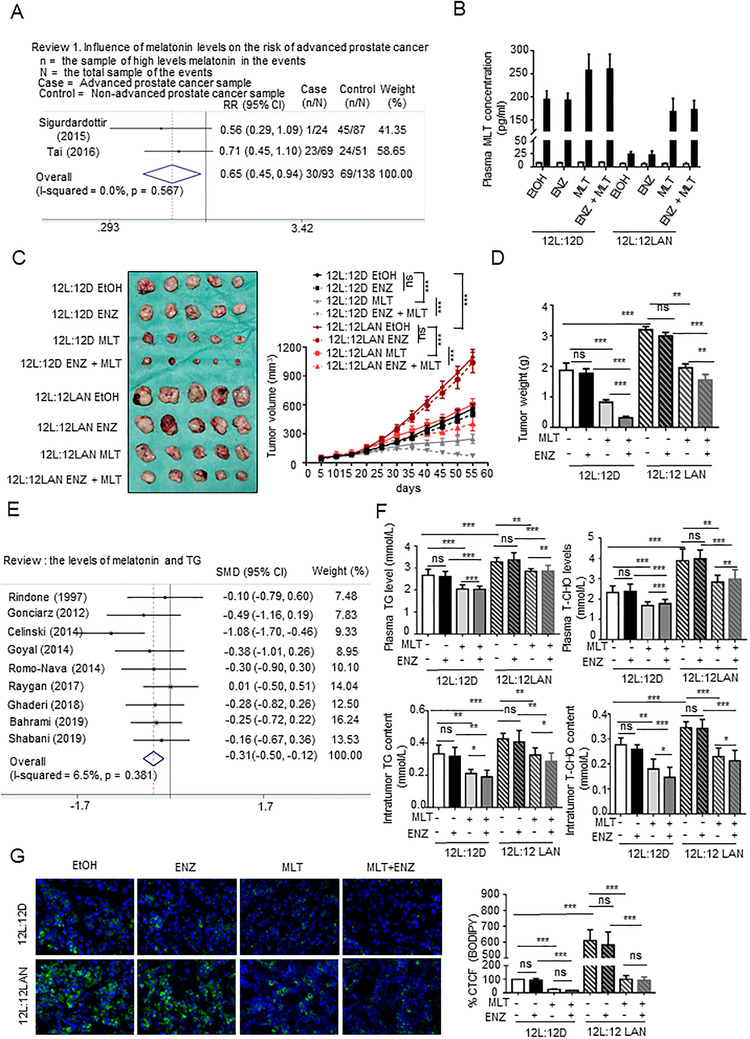
MLT reduced lipid accumulation in PCa. (A) Meta‐analysis of the melatonin levels and risk of advanced PCa. (B) The plasma MLT levels in all groups, which were assayed as described in “Materials and Methods” at 12:00 and 24:00 h. (C and D) C57BL/6 mice bearing Rm‐1 cell xenograft tumors were treated as described in “Materials and Methods”. Tumor volumes were measured every 5 days. (n = 5 per group). Tumors were weighed after resection. The graphs show the means ± SEM. One‐way ANOVA followed by Tukey's multiple comparison test, α = 0.05; *p < 0.05, **p < 0.01, and ***p < 0.001. (E) Meta‐analysis of melatonin and TG levels in the blood. (F) Assays of the TG and T‐CHO contents in the Rm‐1 tumor tissues and in the serum of all groups were used to generate indicators of intracellular lipids. The graphs present the means ± SEM. (G) The Rm‐1 tumor tissues were stained with BODIPY (green) and DAPI (blue). Representative images of BODIPY staining under each condition. Quantification of the corrected total cell fluorescence (CTCF) of BODIPY staining. The graphs present the means ± SEM. Abbreviations: ns, no significance; RR, risk ratio; SMD, standard mean difference.