
FIGURE 2.
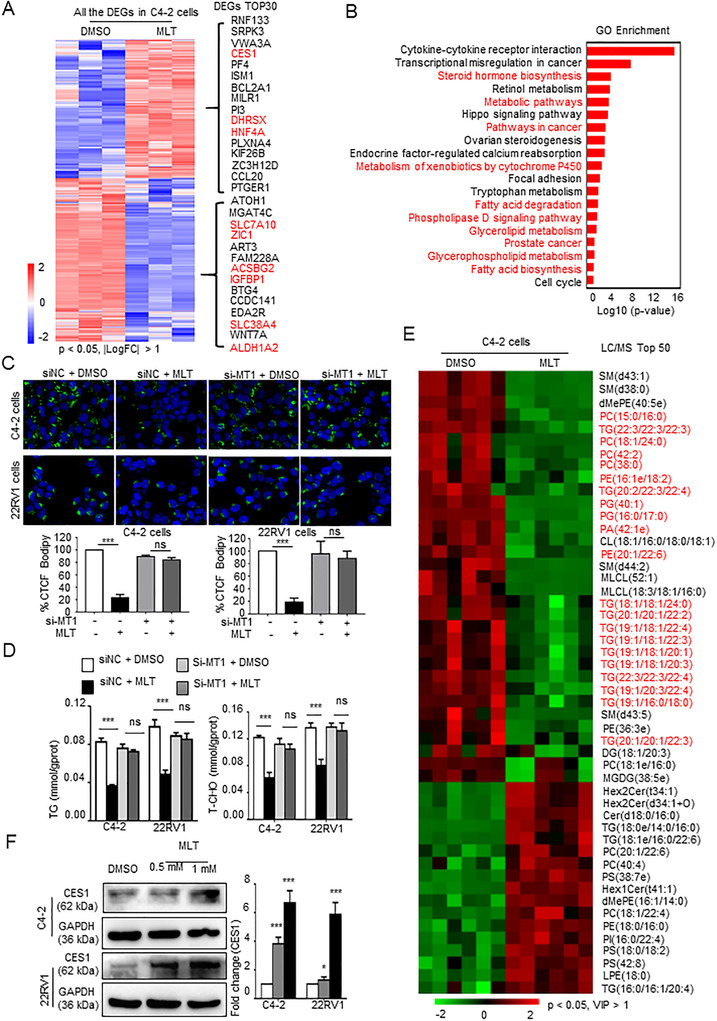
MLT promotes the expression of the lipid metabolism‐related CES1 gene. (A) Heat map of the statistically significantly differentially expressed genes (DEGs) according to the RNA sequencing data from the MLT‐treated (1 mM) C4‐2 cells versus the cells treated with vehicle control (DMSO). Heat map of top 30 DEGs identified by RNA sequencing was showed with their gene names. Red: lipid metabolism genes. n = 3, p < 0.05, |LogFC| > 1. (B) GO analysis of the DEGs indicated that MLT treatment is significantly associated with the lipid metabolism signaling pathway. (C) C4‐2 and 22RV1 cells were transfected with siMT‐1 or siNC (control). After 48 h, the cells were incubated with DMSO or MLT (1 mM) for 48 h and stained with BODIPY (green) and DAPI (blue). Representative images of BODIPY staining under each condition. Quantification of CTCF. (D) Total cell triglyceride (TG) and cholesterol (T‐CHO) contents were measured in cells treated with MLT (1 mM, 48 h) or DMSO using TG or total cholesterol assay kits. (E) Heat map of the top 50 lipid metabolites with statistically significant differences according to the LC‐MS/MS lipidomic assay performed to detect intracellular lipids in the C4‐2 cells treated with MLT (1 mM, 48 h) or DMSO (n = 6). Student's t test, p < 0.05, VIP > 1. (F) Detection of the CES1 expression in the C4‐2 and 22RV1 cells treated with various concentrations of MLT. Densitometry and statistical analysis. Representative images are shown