
FIGURE 6.
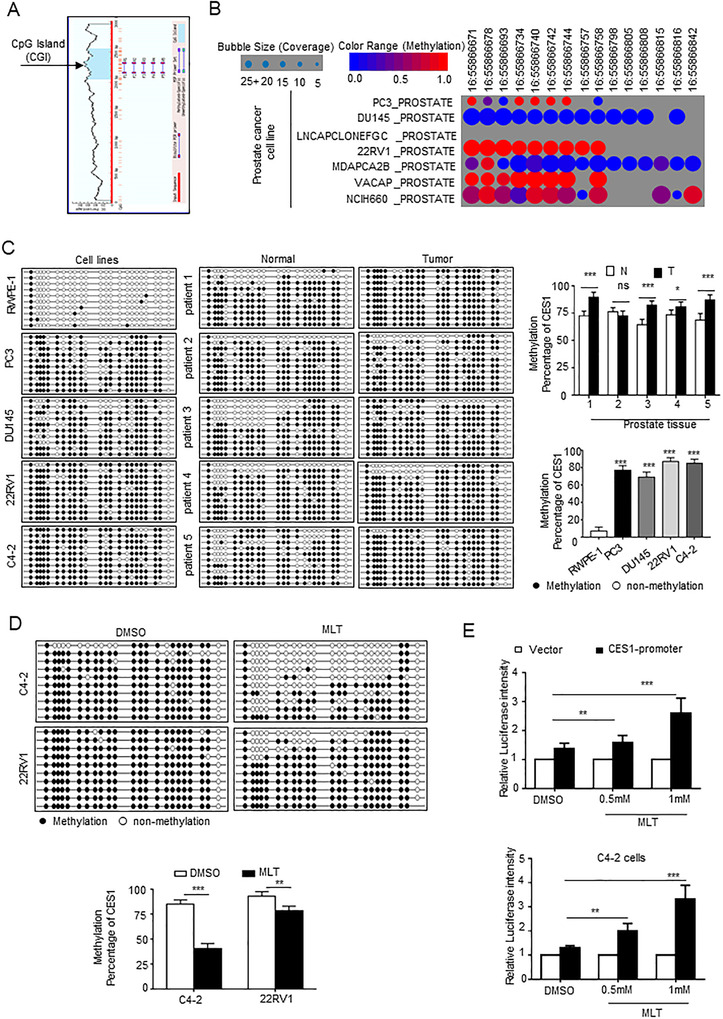
MLT‐mediated epigenetic modification upregulates CES1 expression. (A) Prediction of the CpG islands (CGIs) in CES1 promoter regions using MethPrimer. (B) The publicly available database Cancer Cell Line Encyclopedia (CCLE) was used in bioinformatics analyses to evaluate the methylation status of the CES1 promoter in PCa cell lines. (C) Detection of the methylation status of the CES1 promoter in PCa cells (PC3, C4‐2, 22RV1, and DU145), normal prostate epithelial cells (RWPE‐1), five paired PCa tissue and adjacent normal prostate tissue samples using BSP sequencing. Then statistical analysis. (D) Using BSP assays, detect and statistical analysis for the CGI methylation status of the CES1 promoter in C4‐2 and 22RV1 cells treated with 1 mM MLT (1 mM, 48 h) compared to that in the control (DMSO treatment). (E) Luciferase reporter assays were performed after cotransfection of the pGMLR‐CMV luciferase reporter and the CES1 promoter or blank vector plasmids in 22RV1 and C4‐2 cells treated with various concentrations of MLT