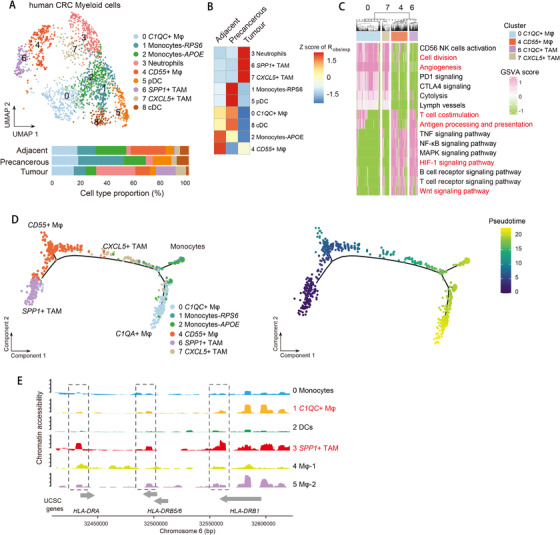
FIGURE 5.

Tumor‐associated macrophage subpopulations in CRC. (A) UMAP plot of myeloid cells (top). Bar plot of cell proportions in adjacent, precancerous, and tumor tissues (bottom). (B) Tissue preference of each cluster estimated by observed‐to‐expected ratio (R obs/exp). The R obs/exp was z‐score transformed. (C) Pathway enriched in C1QC + and SPP1 + TAMs, and CXCL5 + and CD55+ macrophages. Prominent pathway terms are highlighted in red. Mean score of GSVA was z‐score transformed. (D) t‐SNE plots showing pseudo‐time paths of monocytes, C1QC + and SPP1 + TAMs, and CXCL5 + and CD55+ macrophages. (E) Genomic region of HLA‐DRB locus showing ATAC‐seq tracks of aggregated single cells of myeloid cells
