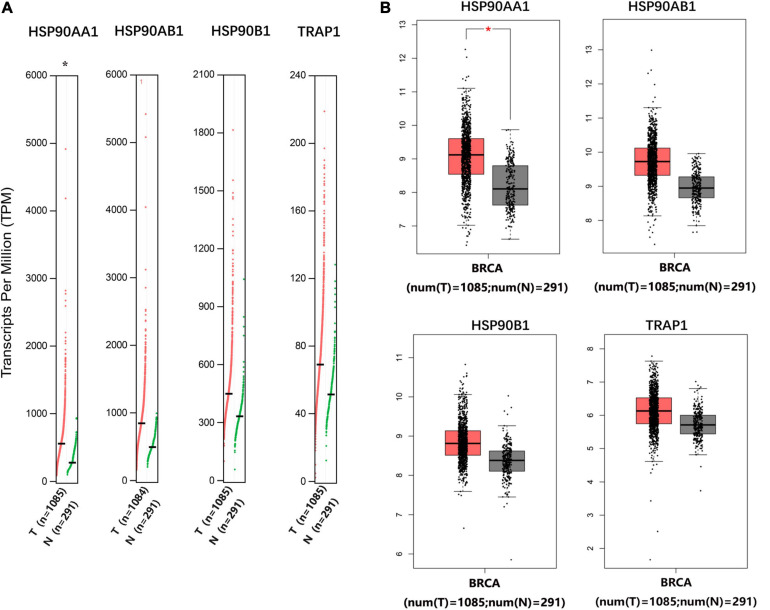
FIGURE 1.
Gene Expression Profiling Interactive Analysis of the expression profiles of HSP90AA1, HSP90AB1, HSP90B1, and TRAP1 in breast cancer patients. The profile shows the tissue-wise expression of heat shock protein 90 kDa family gene signatures in breast cancer using (A) a dot plot and (B) a box plot match of TCGA normal and GTEx data. *Indicates a statistically significant difference (p < 0.05).

