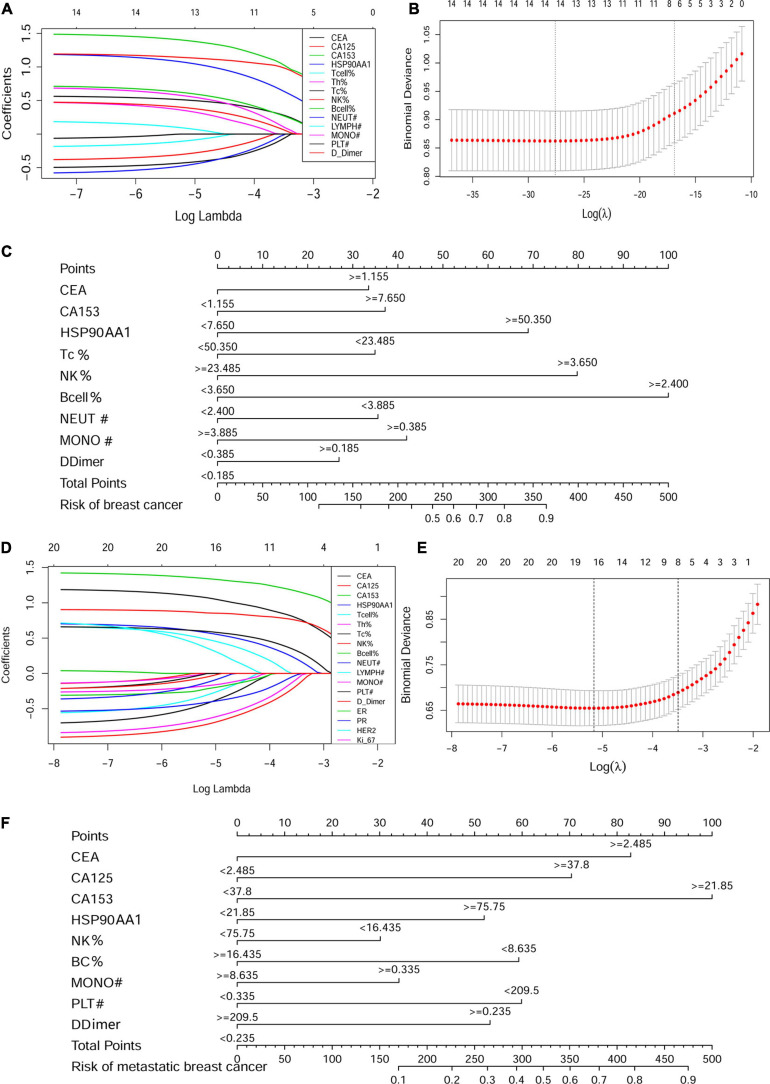
FIGURE 7.
Construction of the cancer risk and metastasis risk nomograms containing HSP90AA1. LASSO coefficient profiles of the (A) 14 factors in the cancer risk cohort and (D) 21 factors in the metastasis risk cohort. A coefficient profile plot was produced against the logλ sequence. (B,E) Selection results of the LASSO model. The partial likelihood deviance (binomial deviance) curve is plotted versus logλ. Dotted vertical lines are drawn at the optimal values by using the minimum criteria and the 1 SE of the minimum standards (the 1-SE rules). Development of the (C) breast cancer risk nomogram and (F) metastasis risk nomogram. LASSO, least absolute shrinkage and selection operator.

