FIGURE 2.
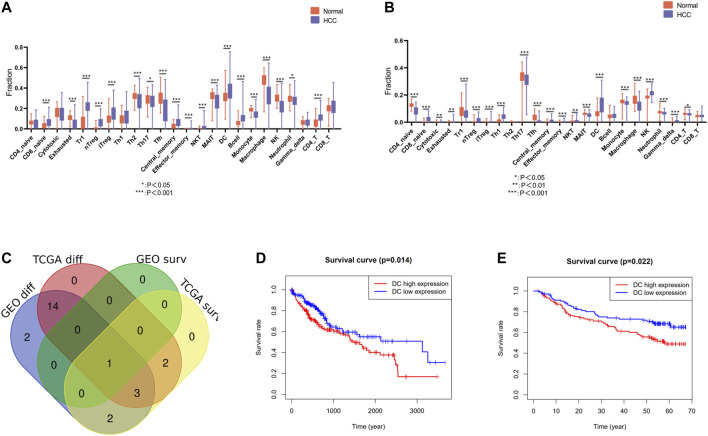
Identification of differentially infiltrated and prognostic immune cells. (A) Differentially infiltrated immune cells between HCC tissues and nontumor tissues in the TCGA cohort. (B) Differentially infiltrated immune cells between HCC tissues and nontumor tissues in the GEO cohort. (C) Venn diagram of differentially infiltrated and prognostic immune cells in TCGA cohort and GEO cohort. (D) Kaplan–Meier analysis of DCs in the TCGA cohort (E) Kaplan–Meier analysis of DCs in the GEO cohort.

