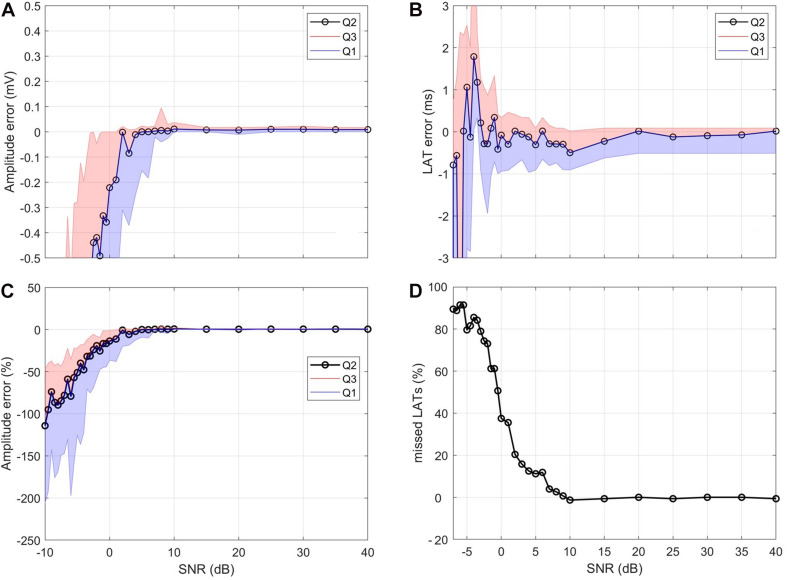
FIGURE 6.
Influence of noise. (A) Median (Q2) amplitude error and interquartile distance (Q1, Q3). (B) Median LAT error and interquartile distance. (C) Relative amplitude error with respect to true amplitude. (D) Percentage of missed LAT detections. For (A,B) the y-axis was capped for visualization purposes.

