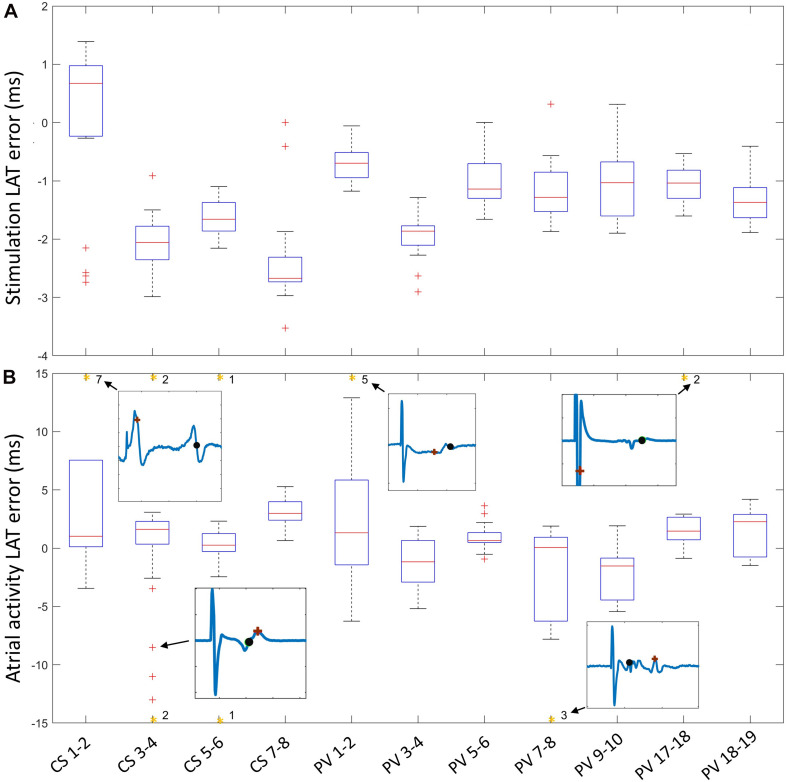
FIGURE 7.
LAT error of stimulation signal (A) and atrial activity (B) calculated by subtraction of pipeline LAT from expert annotation. The number of outliers beyond the y-axis limit (orange asterisk) is shown, along with an exemplary signal showing the differences between the expert annotation (black) and the pipeline annotation (brown).

