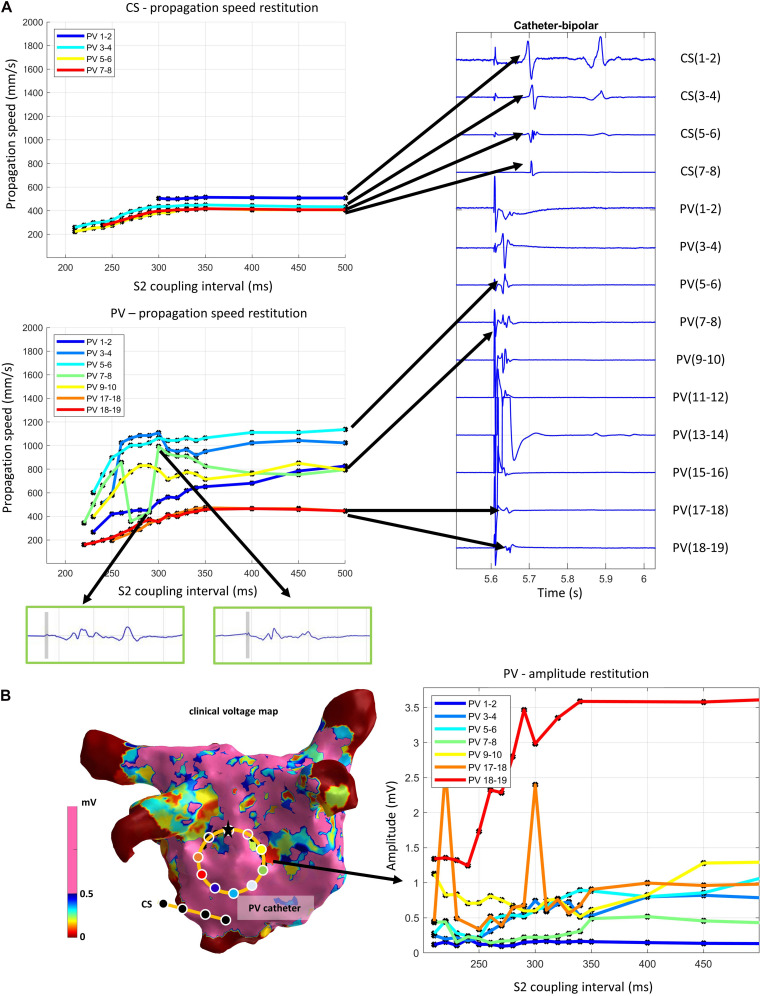
FIGURE 8.
(A) Exemplary output of the pipeline applied on a clinical measurement with stimulation from the circular catheter electrodes 13–14. Propagation speed restitution curves of each channel of the CS and the circular (PV) catheter (left) and the first corresponding S2 signal segment (right). Green boxes show excerpts of atrial activity signal after removal of the stimulation artifact (time segment marked in gray). (B) Voltage map (left) with circular catheter (PV) with white circles showing bipolar channel positions. Reconstructed amplitudes of circular catheter (stimulation from electrodes 13–14) with black dots representing data points (right). Lines are linearly interpolated in between. Line colors correspond to the color of the dot of the channel position on the voltage map.

