Figure 2.
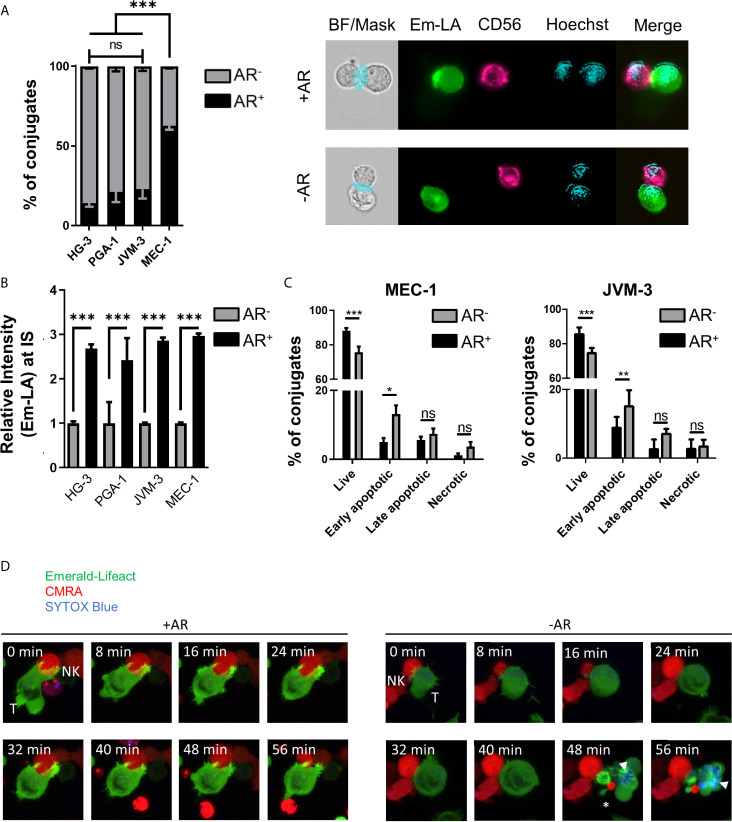
Quantification and functional consequence of the actin response during NK cell attack. (A) Quantitative Imagestream analysis of CLL-NK cell conjugates. CLL cells HG-3, PGA-1, JVM-3 and MEC-1 were analyzed for their actin response frequency in conjugates with NK-92MI cells. Percentages of target cells in conjugation with NK-92MI cells with (black, AR+) and without (grey, AR-) an actin response. *** denotes p < 0.0001 (B) Relative intensity of Emerald-Lifeact at the IS in target cells conjugates with NK cells with respect to absence (grey, AR-) to presence (black, AR+). Data represents results of 6 different experiments and plots over 2000 conjugates per cell line. Data was normalized to conjugates without an AR. *** denotes p < 0.0001 (C) Imagestream analysis of target cell death in CLL target cells conjugated with NK cells in the presence (black, AR+) or absence (grey, AR-) of an actin response. Target cell death was assessed by Annexin V and propidium iodide staining. * denotes p<0.05, ** denotes p< 0.001, *** denotes p < 0.0001 (D) Time lapse imaging of actin dynamics in MEC-1 CLL cells upon NK cell attack. The AR+ target cell can resist NK cell-induced cell death. Target cells not capable to produce an actin response are effectively lysed as seen by the SYTOX blue staining (white arrow head) and disappearance of normal cellular structures and membrane blebbing (asterisk). ns, non significant.

