Figure 5.
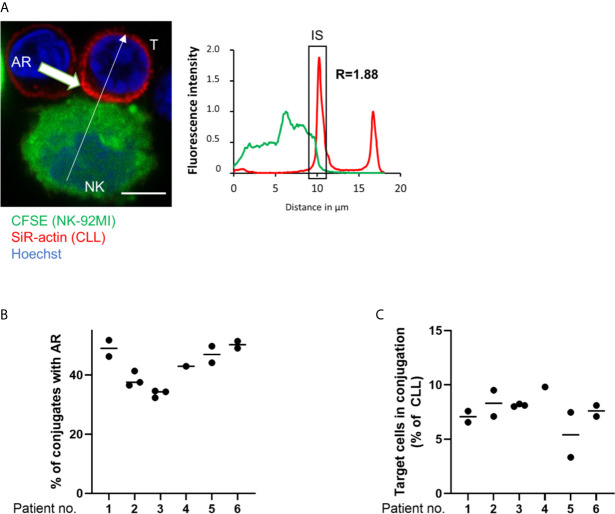
The actin response in patient-derived primary CLL cells. (A) Representative confocal microscopy image of an immune synapse between a primary CLL cell (T) and NK-92MI cell (NK). The chart to the right shows the relative fluorescent intensity of SiR-actin along the trajectory (white arrow). The fluorescence was normalized to 1 at the opposite site of the synapse. The region of the immunological synapse is indicated with “IS”. Bar: 10 µm (B) Quantitative imaging flow cytometry analysis of the AR in primary CLL cells in conjugation with NK-92MI effector cells. CLL cells were identified as CD5+/CD19+ cells. Actin staining was performed using spirochrome labelling. (C) Quantification of primary CLL cells in conjugation with NK-92MI cells after 45 minutes of co-culture as percentage of total target population.

