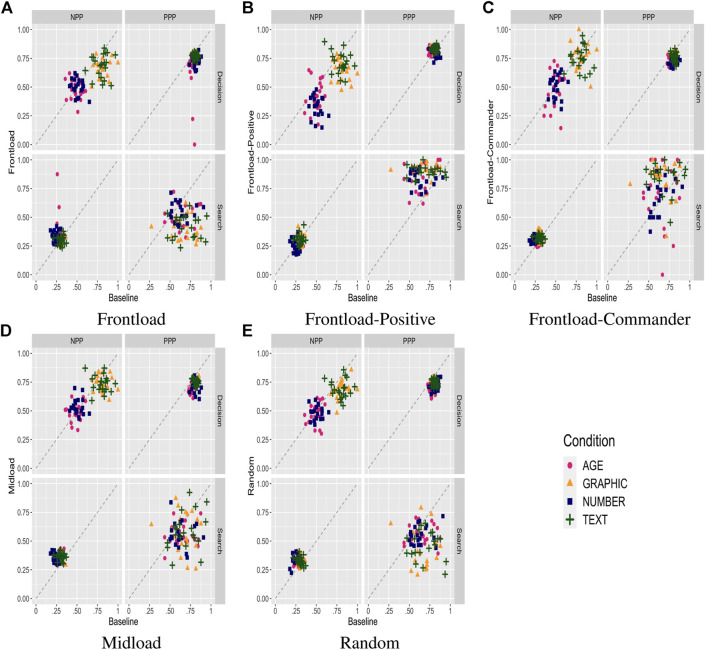
FIGURE 7.
Predictive power statistics plotted with the Baseline condition scores on the x-axis and one of the cue-performance disruption manipulations on the y-axis. The subplots capture the different manipulations. (A) Frontload. (B) Frontload-Positive. (C) Frontload-Commander. (D) Midload. (E) Random.

