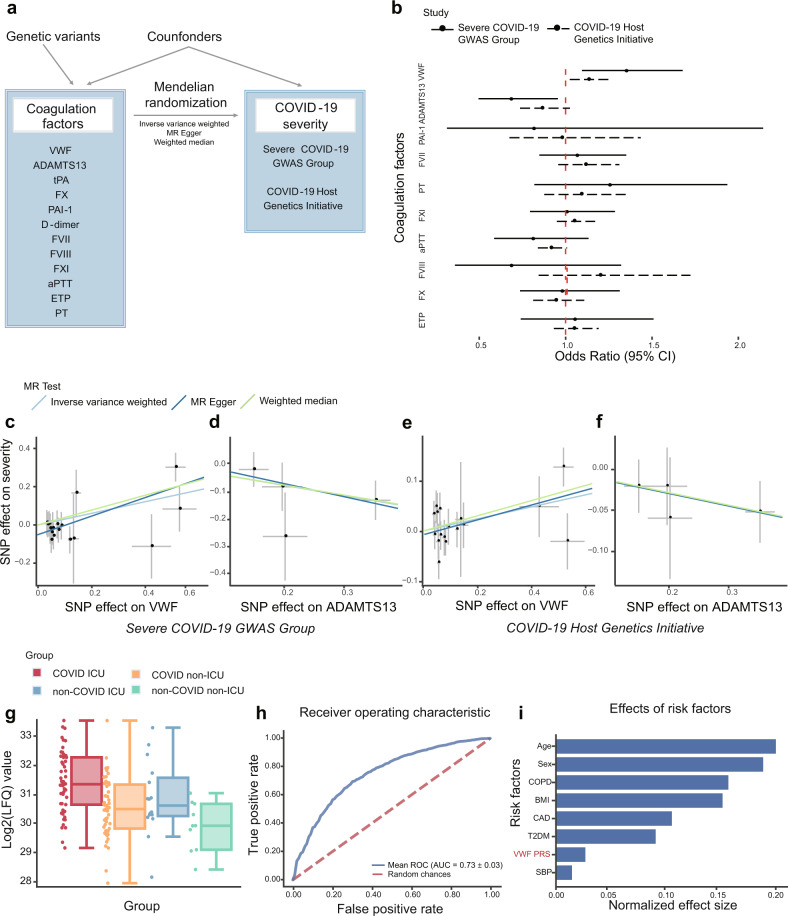
Fig. 1.
Mendelian randomization analyses and validation between coagulation factors and COVID-19 severity. a Mendelian randomization analysis framework in this study. A directed acyclic graph illustrates Mendelian randomization assumptions. The solid lines depict the potential causal diagram. b Forest plot shows odds ratio (OR) and 95% confidence interval (CI) from the results of IVW MR. The solid lines indicate MR results based on COVID-19 GWAS data from the Severe COVID-19 GWAS Group and the dashed lines indicate MR results based on COVID-19 GWAS data from the COVID-19 Host Genetics Initiative. D-dimer and tPA are excluded in this plot for abnormal OR values. c–f Scatter plots of the estimated genetic associations on the COVID-19 severity against the genetic association estimates with the VWF and ADAMTS13. The MR results are based on COVID-19 GWAS from (c, d) the Severe COVID-19 GWAS Group; (e, f) the COVID-19 Host Genetics Initiative. The slopes of the lines are the estimated causal effects using different MR methods including inverse variance weighted, MR Egger regression, and weighted median. g Relative abundance measurements of VWF protein in different patient groups. The relative abundance of VWF protein was estimated based on the relative abundances of its unique peptides. Different colors indicate patient status: COVID-19 ICU (red), COVID-19 non-ICU (orange), non-COVID-19 ICU (blue), and non-COVID-19 non-ICU (green). This image was created using data from COVID-19 Multi-Omics Data Dashboard (https://covid-omics.app). h Predictive ability of VWF PRS and clinical risk factors against COVID-19 severity. Receiver operating characteristic (ROC) for logistic regression using clinical risk factors and PRS derived from VWF GWAS as independent variables, the area under the receiver operating characteristic curve (AUC) was the mean value for 10-fold cross-validation. i Barplot depicts the normalized effect size of each contributing variable, values of each bar are coefficients of logistic regression after normalizing raw values to the same scale via z-score normalization. MR Mendelian randomization, VWF von Willebrand factor, ADAMTS13 a disintegrin and metalloproteinase with a thrombospondin type 1 motif, member 13, tPA tissue plasminogen activator, PAI-1 plasminogen activator inhibitor-1, FVII Factor VII, PT prothrombin time, FVIII Factor VIII, FXI Factor XI, aPTT activated partial thromboplastin time, FX Factor X, ETP endogenous thrombin potential, LFQ label-free quantification, ICU intensive care unit, BMI body mass index, CAD coronary artery disease, COPD chronic obstructive pulmonary disease, PRS polygenic risk score, T2DM type 2 diabetes mellitus

