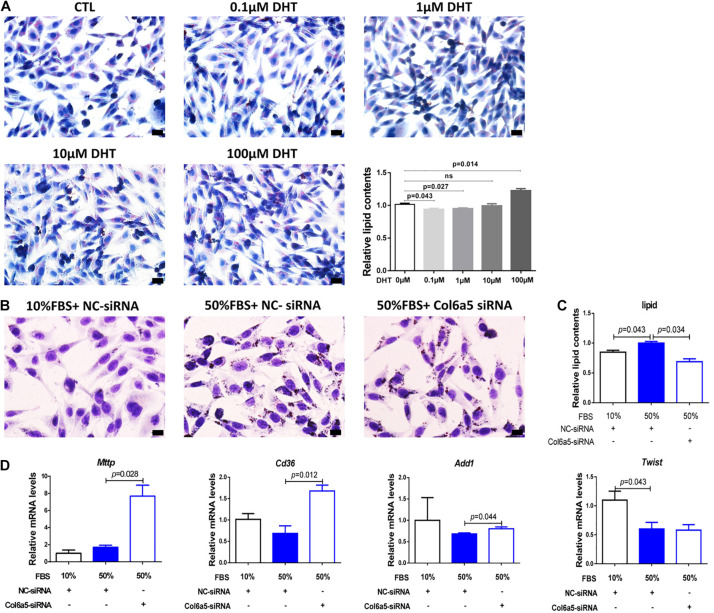
FIGURE 6.
Col6a5-siRNA alleviated excess lipid accumulation in overnourished NCTC1469 cells. (A) Oil Red O staining and relative quantification of lipid concentrations in DHT-treated NCTC1469 cells; n = 3, scale bars = 20 μm. NCTC1469, a mouse hepatic cell line. Cells were cultured in medium with DHT for 24 h; n = 3. The data are expressed as the mean ± SEM and were compared by Mann-Whitney U-test. (B) Oil Red O staining and (C) relative quantification of lipid concentrations in overnourished NCTC1469 cells; n = 3, scale bars = 20 μm. (D) Relative expression of lipid metabolism-related genes in NCTC1469 cells from each treatment group; n = 3. The data are expressed as the mean ± SEM and were compared by Mann-Whitney U-test.

