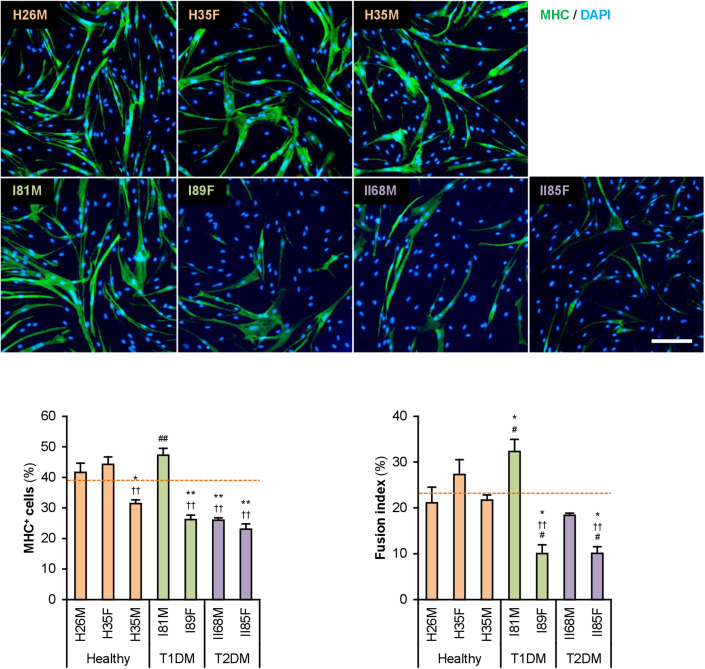
FIGURE 1.
Attenuated myogenic differentiation of DM myoblasts. Representative immunofluorescent images of the hMBs differentiated in DIM-NG for 2 days. Scale bar, 200 μm. Ratio of MHC+ cells and multinuclear myotubes were quantified. Orange dashed lines indicate the mean values of H26M, H35F, and H35M. *p < 0.05, **p < 0.01 vs. H26M; ††p < 0.01 vs. H35F; #p < 0.05, ##p < 0.01 vs. H35M (Tukey–Kramer test); n = 6.

